| The PHREG Procedure |
| Hazard Ratios |
Consider a dichotomous risk factor variable X that takes the value 1 if the risk factor is present and 0 if the risk factor is absent. The log-hazard function is given by
 |
where  is the baseline hazard function.
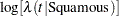
The hazard ratio  is defined as the ratio of the hazard for those with the risk factor (
 ) to the hazard without the risk factor (
 ). The log of the hazard ratio is given by
 |
In general, the hazard ratio can be computed by exponentiating the difference of the log-hazard between any two population profiles. This is the approach taken by the HAZARDRATIO statement, so the computations are available regardless of parameterization, interactions, and nestings. However, as shown in the preceding equation for  , hazard ratios of main effects can be computed as functions of the parameter estimates, and the remainder of this section is concerned with this methodology.
The parameter,  , associated with X represents the change in the log-hazard from to . So the hazard ratio is obtained by simply exponentiating the value of the parameter associated with the risk factor. The hazard ratio indicates how the hazard change as you change
  from 0 to 1. For instance,
  means that the hazard when is twice the hazard when .
Suppose the values of the dichotomous risk factor are coded as constants  and
and  instead of 0 and 1. The hazard when
  becomes
  , and the hazard when
  becomes
  . The hazard ratio corresponding to an increase in from to is
 |
Note that for any and such that  . So the hazard ratio can be interpreted as the change in the hazard for any increase of one unit in the corresponding risk factor. However, the change in hazard for some amount other than one unit is often of greater interest. For example, a change of one pound in body weight might be too small to be considered important, while a change of 10 pounds might be more meaningful. The hazard ratio for a change in from to is estimated by raising the hazard ratio estimate for a unit change in to the power of
  as shown previously.
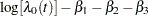
For a polytomous risk factor, the computation of hazard ratios depends on how the risk factor is parameterized. For illustration, suppose that Cell is a risk factor with four categories: Adeno, Large, Small, and Squamous.
For the effect parameterization scheme (PARAM=EFFECT) with Squamous as the reference group, the design variables for Cell are as follows:
Design Variables |
|||
|---|---|---|---|
Cell |
|
|
|
Adeno |
|
|
|
Large |
|
|
|
Small |
|
|
|
Squamous |
|
|
|


The log-hazard for Adeno is
 |
 |
 |
|||
 |
|
 |
The log-hazard for Squamous is
 |
|
 |
|||
|
|
 |
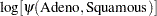
Therefore, the log-hazard ratio of Adeno versus Squamous
 |
|
 |
|||
|
|
 |
For the reference cell parameterization scheme (PARAM=REF) with Squamous as the reference cell, the design variables for Cell are as follows:
Design Variables |
|||
|---|---|---|---|
Cell |
|
|
|
Adeno |
|
|
|
Large |
|
|
|
Small |
|
|
|
Squamous |
|
|
|
The log-hazard ratio of Adeno versus Squamous is given by
 |
|||||
|
 |
|
|||
|
|
 |
|||
|
|
 |
|||
|
|
 |
|||
For the GLM parameterization scheme (PARAM=GLM), the design variables are as follows:
Design Variables |
||||
|---|---|---|---|---|
Cell |
|
|
|
|
Adeno |
|
|
|
|
Large |
|
|
|
|
Small |
|
|
|
|
Squamous |
|
|
|
|

The log-hazard ratio of Adeno versus Squamous is
|
|||||
|
|
|
|||
|
|
 |
|||
|
|
 |
|||
|
|
 |
|||
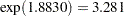
Consider Cell as the only risk factor in the Cox regression in Example 64.3. The computation of hazard ratio of Adeno versus Squamous for various parameterization schemes is tabulated in Table 64.8.
Parameter Estimates |
|||||
|---|---|---|---|---|---|
PARAM= |
|
|
|
|
Hazard Ratio Estimates |
EFFECT |
0.5772 |
–0.2115 |
0.2454 |
|
|
REF |
1.8830 |
0.3996 |
0.8565 |
|
|
GLM |
1.8830 |
0.3996 |
0.8565 |
0.0000 |
|


The fact that the log-hazard ratio () is a linear function of the parameters enables the HAZARDRATIO statement to compute the hazard ratio of the main effect even in the presence of interactions and nest effects. The section Hazard Ratios details the estimation of the hazard ratios in a classical analysis.
To customize hazard ratios for specific units of change for a continuous risk factor, you can use the UNITS= option in a HAZARDRATIO statement to specify a list of relevant units for each explanatory variable in the model. Estimates of these customized hazard ratios are given in a separate table. Let  be a confidence interval for . The corresponding lower and upper confidence limits for the customized hazard ratio
  are
are  and
and  , respectively (for
  ), or and , respectively (for
  ).
).
Copyright © SAS Institute, Inc. All Rights Reserved.