| The CLUSTER Procedure |
Example 29.1 Cluster Analysis of Flying Mileages between 10 American Cities
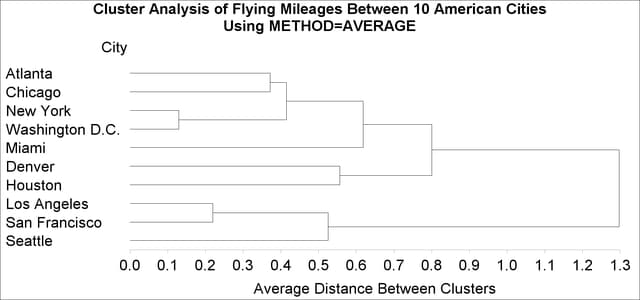
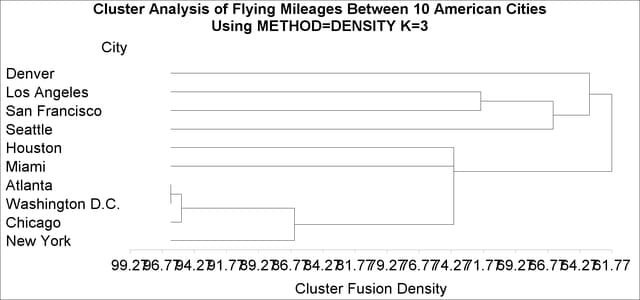
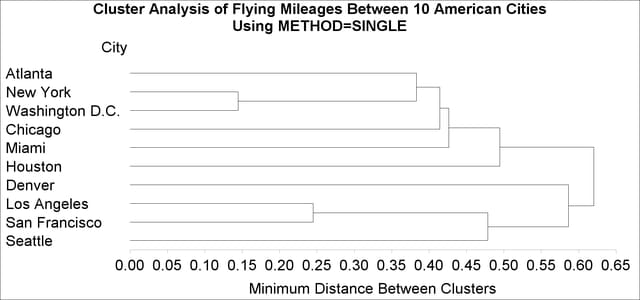
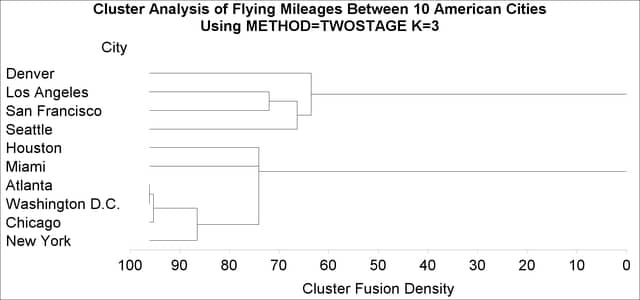
This example clusters 10 American cities based on the flying mileages between them. Six clustering methods are shown with corresponding tree diagrams produced by the TREE procedure. The EML method cannot be used because it requires coordinate data. The other omitted methods produce the same clusters, although not the same distances between clusters, as one of the illustrated methods: complete linkage and the flexible-beta method yield the same clusters as Ward’s method, McQuitty’s similarity analysis produces the same clusters as average linkage, and the median method corresponds to the centroid method.
All of the methods suggest a division of the cities into two clusters along the east-west dimension. There is disagreement, however, about which cluster Denver should belong to. Some of the methods indicate a possible third cluster containing Denver and Houston.
title 'Cluster Analysis of Flying Mileages Between 10 American Cities';

data mileages(type=distance);
   input (Atlanta Chicago Denver Houston LosAngeles
         Miami NewYork SanFrancisco Seattle WashingtonDC) (5.)
         @56 City $15.;
   datalines;
    0                                                  Atlanta
  587    0                                             Chicago
 1212  920    0                                        Denver
  701  940  879    0                                   Houston
 1936 1745  831 1374    0                              Los Angeles
  604 1188 1726  968 2339    0                         Miami
  748  713 1631 1420 2451 1092    0                    New York
 2139 1858  949 1645  347 2594 2571    0               San Francisco
 2182 1737 1021 1891  959 2734 2408  678    0          Seattle
  543  597 1494 1220 2300  923  205 2442 2329    0     Washington D.C.
;

goptions htext=0.15in htitle=0.15in;
A partial listing from following statements include Output 29.1.1 and Output 29.1.2:
/*---------------------- Average linkage --------------------*/
title2 'Using METHOD=AVERAGE';
proc cluster data=mileages outtree=tree method=average pseudo;
  id City;
run;

proc tree horizontal; id City; run;
| Cluster Analysis of Flying Mileages Between 10 American Cities |
| Using METHOD=AVERAGE |
| Cluster History | |||||||
|---|---|---|---|---|---|---|---|
| NCL | Clusters Joined | FREQ | PSF | PST2 | Norm RMS Dist |
T i e |
|
| 9 | New York | Washington D.C. | 2 | 66.7 | . | 0.1297 | |
| 8 | Los Angeles | San Francisco | 2 | 39.2 | . | 0.2196 | |
| 7 | Atlanta | Chicago | 2 | 21.7 | . | 0.3715 | |
| 6 | CL7 | CL9 | 4 | 14.5 | 3.4 | 0.4149 | |
| 5 | CL8 | Seattle | 3 | 12.4 | 7.3 | 0.5255 | |
| 4 | Denver | Houston | 2 | 13.9 | . | 0.5562 | |
| 3 | CL6 | Miami | 5 | 15.5 | 3.8 | 0.6185 | |
| 2 | CL3 | CL4 | 7 | 16.0 | 5.3 | 0.8005 | |
| 1 | CL2 | CL5 | 10 | . | 16.0 | 1.2967 | |
A partial listing from following statements include Output 29.1.3 and Output 29.1.4:
/*---------------------- Centroid method --------------------*/
title2 'Using METHOD=CENTROID';
proc cluster data=mileages method=centroid pseudo;
   id City;
run;

proc tree horizontal; id City; run;
| Cluster Analysis of Flying Mileages Between 10 American Cities |
| Using METHOD=CENTROID |
| Cluster History | |||||||
|---|---|---|---|---|---|---|---|
| NCL | Clusters Joined | FREQ | PSF | PST2 | Norm Cent Dist |
T i e |
|
| 9 | New York | Washington D.C. | 2 | 66.7 | . | 0.1297 | |
| 8 | Los Angeles | San Francisco | 2 | 39.2 | . | 0.2196 | |
| 7 | Atlanta | Chicago | 2 | 21.7 | . | 0.3715 | |
| 6 | CL7 | CL9 | 4 | 14.5 | 3.4 | 0.3652 | |
| 5 | CL8 | Seattle | 3 | 12.4 | 7.3 | 0.5139 | |
| 4 | Denver | CL5 | 4 | 12.4 | 2.1 | 0.5337 | |
| 3 | CL6 | Miami | 5 | 14.2 | 3.8 | 0.5743 | |
| 2 | CL3 | Houston | 6 | 22.1 | 2.6 | 0.6091 | |
| 1 | CL2 | CL4 | 10 | . | 22.1 | 1.173 | |

A partial listing from following statements include Output 29.1.5 and Output 29.1.6:
/*-------- Density linkage with 3rd-nearest-neighbor --------*/
title2 'Using METHOD=DENSITY K=3';
proc cluster data=mileages method=density k=3;
   id City;
run;

proc tree horizontal; id City; run;
| Cluster Analysis of Flying Mileages Between 10 American Cities |
| Using METHOD=DENSITY K=3 |
| Cluster History | ||||||||
|---|---|---|---|---|---|---|---|---|
| NCL | FREQ | Normalized Fusion Density |
Maximum Density in Each Cluster |
T i e |
||||
| Clusters Joined | Lesser | Greater | ||||||
| 9 | Atlanta | Washington D.C. | 2 | 96.106 | 92.5043 | 100.0 | ||
| 8 | CL9 | Chicago | 3 | 95.263 | 90.9548 | 100.0 | ||
| 7 | CL8 | New York | 4 | 86.465 | 76.1571 | 100.0 | ||
| 6 | CL7 | Miami | 5 | 74.079 | 58.8299 | 100.0 | T | |
| 5 | CL6 | Houston | 6 | 74.079 | 61.7747 | 100.0 | ||
| 4 | Los Angeles | San Francisco | 2 | 71.968 | 65.3430 | 80.0885 | ||
| 3 | CL4 | Seattle | 3 | 66.341 | 56.6215 | 80.0885 | ||
| 2 | CL3 | Denver | 4 | 63.509 | 61.7747 | 80.0885 | ||
| 1 | CL5 | CL2 | 10 | 61.775 | * | 80.0885 | 100.0 | |
A partial listing from following statements include Output 29.1.7 and Output 29.1.8:
/*--------------------- Single linkage ----------------------*/
title2 'Using METHOD=SINGLE';
proc cluster data=mileages method=single;
   id City;
run;

proc tree horizontal; id City; run;
| Cluster Analysis of Flying Mileages Between 10 American Cities |
| Using METHOD=SINGLE |
| Cluster History | |||||
|---|---|---|---|---|---|
| NCL | Clusters Joined | FREQ | Norm Min Dist |
T i e |
|
| 9 | New York | Washington D.C. | 2 | 0.1447 | |
| 8 | Los Angeles | San Francisco | 2 | 0.2449 | |
| 7 | Atlanta | CL9 | 3 | 0.3832 | |
| 6 | CL7 | Chicago | 4 | 0.4142 | |
| 5 | CL6 | Miami | 5 | 0.4262 | |
| 4 | CL8 | Seattle | 3 | 0.4784 | |
| 3 | CL5 | Houston | 6 | 0.4947 | |
| 2 | Denver | CL4 | 4 | 0.5864 | |
| 1 | CL3 | CL2 | 10 | 0.6203 | |
A partial listing from following statements include Output 29.1.9 and Output 29.1.10:
/*--- Two-stage density linkage with 3rd-nearest-neighbor ---*/
title2 'Using METHOD=TWOSTAGE K=3';
proc cluster data=mileages method=twostage k=3;
   id City;
run;

proc tree horizontal; id City; run;
| Cluster Analysis of Flying Mileages Between 10 American Cities |
| Using METHOD=TWOSTAGE K=3 |
| Cluster History | |||||||
|---|---|---|---|---|---|---|---|
| NCL | FREQ | Normalized Fusion Density |
Maximum Density in Each Cluster |
T i e |
|||
| Clusters Joined | Lesser | Greater | |||||
| 9 | Atlanta | Washington D.C. | 2 | 96.106 | 92.5043 | 100.0 | |
| 8 | CL9 | Chicago | 3 | 95.263 | 90.9548 | 100.0 | |
| 7 | CL8 | New York | 4 | 86.465 | 76.1571 | 100.0 | |
| 6 | CL7 | Miami | 5 | 74.079 | 58.8299 | 100.0 | T |
| 5 | CL6 | Houston | 6 | 74.079 | 61.7747 | 100.0 | |
| 4 | Los Angeles | San Francisco | 2 | 71.968 | 65.3430 | 80.0885 | |
| 3 | CL4 | Seattle | 3 | 66.341 | 56.6215 | 80.0885 | |
| 2 | CL3 | Denver | 4 | 63.509 | 61.7747 | 80.0885 | |
| 1 | CL5 | CL2 | 10 | 61.775 | 80.0885 | 100.0 | |
A partial listing from following statements include Output 29.1.11 and Output 29.1.12:
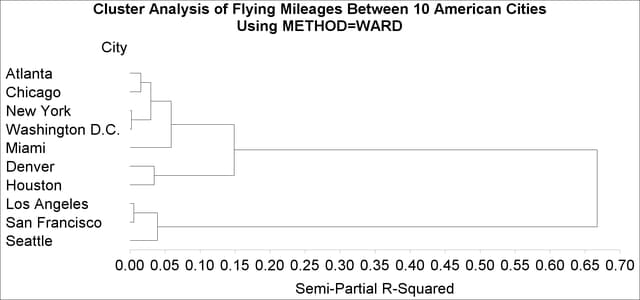
/*------------- Ward's minimum variance method --------------*/
title2 'Using METHOD=WARD';
proc cluster data=mileages method=ward pseudo;
   id City;
run;

proc tree horizontal; id City; run;
| Cluster Analysis of Flying Mileages Between 10 American Cities |
| Using METHOD=WARD |
| Cluster History | ||||||||
|---|---|---|---|---|---|---|---|---|
| NCL | Clusters Joined | FREQ | SPRSQ | RSQ | PSF | PST2 | T i e |
|
| 9 | New York | Washington D.C. | 2 | 0.0019 | .998 | 66.7 | . | |
| 8 | Los Angeles | San Francisco | 2 | 0.0054 | .993 | 39.2 | . | |
| 7 | Atlanta | Chicago | 2 | 0.0153 | .977 | 21.7 | . | |
| 6 | CL7 | CL9 | 4 | 0.0296 | .948 | 14.5 | 3.4 | |
| 5 | Denver | Houston | 2 | 0.0344 | .913 | 13.2 | . | |
| 4 | CL8 | Seattle | 3 | 0.0391 | .874 | 13.9 | 7.3 | |
| 3 | CL6 | Miami | 5 | 0.0586 | .816 | 15.5 | 3.8 | |
| 2 | CL3 | CL5 | 7 | 0.1488 | .667 | 16.0 | 5.3 | |
| 1 | CL2 | CL4 | 10 | 0.6669 | .000 | . | 16.0 | |
Copyright © SAS Institute, Inc. All Rights Reserved.