| The Power and Sample Size Application |
| Test of Two Independent Means for Unequal Variances |
In the preceding example, you assumed that the population standard deviations were equal. If you believe that the population standard deviations are not equal, use the same two-sample t test analysis as with the preceding example, but change the test option and enter group standard deviations.
You can use the previous example to demonstrate this test. If the project is not already open, open it by selecting File Open on the menu bar, and then selecting the project that you have been using.
Make a copy of the project by selecting FileSave As. Enter a different project description, Experimental blood pressure drug with two groups for unequal variances. Click OK.
The copy of the project is opened, and the current project is closed.
Editing Properties
Test
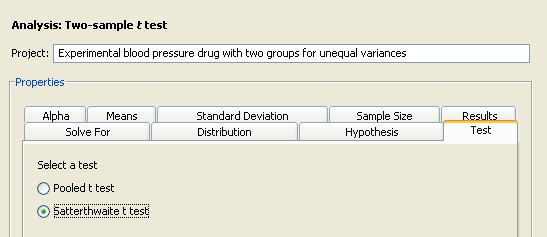
On the Test tab of the copied project, change the test to Satterthwaite t test, as shown in Figure 69.46.
Specifying Group Standard Deviations
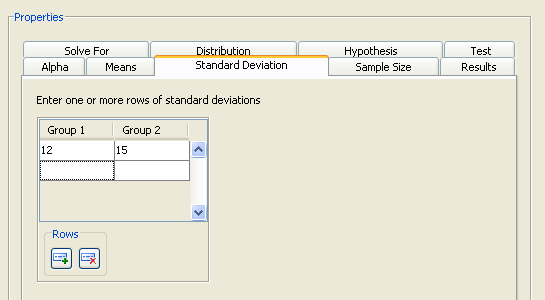
Click the Standard Deviation tab and enter the group standard deviations of 12 and 15 on a single row, as shown in Figure 69.47.
Summary of Input Parameters
Table 69.3 contains the values of the input parameters for the example.
Parameter |
Value |
|---|---|
Distribution |
Normal |
Hypothesis |
One-sided test |
Test |
Satterthwaite t test |
Alpha |
0.05 |
Means form |
Group means |
Means |
132, 120 |
Standard deviation |
12, 15 |
Sample size form |
Sample size per group |
Sample size |
20, 25, 30 |
Click Calculate to run the analysis.
Viewing Results
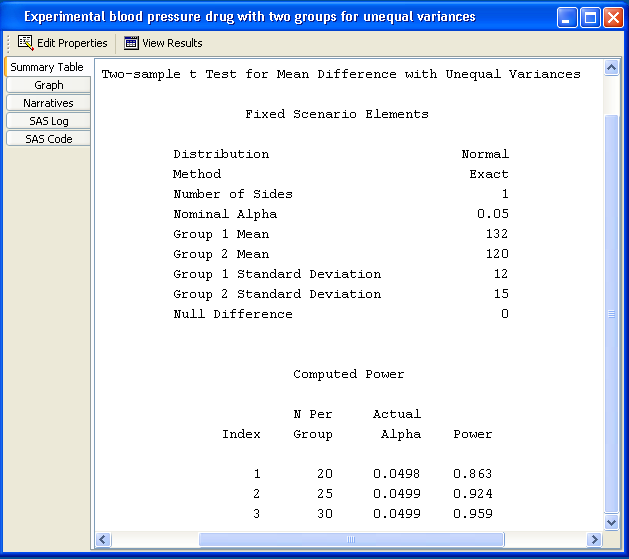
The power for a sample size per group of 25 is 0.924, as shown in Figure 69.48. Notice that the actual alpha is 0.0499. This is because the Satterthwaite t test is (slightly) biased.
If you modified the previous example, when you select the Narratives tab, the following message is displayed:
Previously selected narratives have been cleared because one or more input parameter values have changed.
In the previous analysis, you created narratives for two scenarios. Because this analysis uses group standard deviations, those selected narratives were cleared. The message would also have appeared if you had changed the number of scenarios.
Use the narrative selector table to create other narratives.
Copyright © SAS Institute, Inc. All Rights Reserved.