| The TCALIS Procedure |
Example 88.7 Fitting a Latent Growth Curve Model
Latent factors in structural equation modeling are constructed to represent important unobserved hypothetical constructs. However, with some manipulations latent factors can also represent random effects in models. In this example, a simple latent growth curve model is considered. You use latent factors to represent the random intercepts and slopes in the latent growth curve model.
Sixteen individuals were invited to a training program that was designed to boost self-confidence. During the training, the individuals’ confidence levels were measured at five time points: initially and four more times separated by equal intervals. The data are stored in the following SAS data set:
   data growth;
      input y1 y2 y3 y4 y5;
      datalines;
   17.6  21.4  25.6  32.1  37.7
   13.2  14.3  18.9  20.3  25.4
   11.6  13.5  17.4  22.1  39.6
   10.7  11.1  13.2  18.2  21.4
   18.7  23.7  28.6  31.5  34.0
   18.3  19.2  20.5  23.2  25.9
    9.2  13.5  17.8  19.2  21.1
   18.3  23.5  27.9  30.2  34.6
   11.2  15.6  20.8  22.7  30.4
   17.0  22.9  26.9  31.9  35.6
   10.4  13.6  18.0  25.6  29.3
   17.7  19.0  22.5  28.5  30.7
   14.5  19.4  21.1  28.8  31.5
   20.0  21.4  28.9  30.2  35.6
   14.6  19.3  21.7  28.5  32.0
   11.7  15.2  19.1  23.7  28.7
   ;
First, consider a simple linear regression model for the confidence levels at time  due to training. That is,
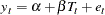 |
where  represents the confidence level at time (
 ),
),  represents the intercept,
  represents the slope or the effect of training,
  represents the fixed time point at (
 and
and  ), and
  is the error term at time .
This simple linear regression assumes that the effect of training (slope) and the intercept are constants for the individuals. However, individual differences are rules rather than exceptions. It is thus more reasonable to argue that an index  for individuals should be added to the intercept and slope in the model. As a result, the following individualized regression model is derived:
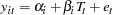 |
where  . In this model, individuals are assumed to have different intercepts and slopes (regression coefficients). Note that theoretically could also be "individualized" as
  in the model. But this is not done because such a model would be unnecessarily complicated without gaining additional insights in return.
Unfortunately, this individualized model with individual intercepts and slopes cannot be estimated directly. If you treat each  and
and  as fixed parameters, you are going to have too many parameters for the model to be identified or estimable. A workable solution is to treat and in the original linear regression model as random variables instead. That is, the latent growth curve model of interest is as follows:
 |
where  is bivariate normal with unknown means, variances, and covariance. Therefore, instead of having
  intercepts and slopes to estimate in the individualized regression model, the final latent growth curve model has to estimate only two means, two variances and one covariance in the bivariate distribution of .
To use PROC TCALIS to fit this latent growth curve model, the random intercept and effect are treated as if they were covarying latent factors. To make them stand out more as latent variables, the random intercept and slope are renamed as  and
and  in the following structural equation:
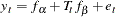 |
where and are bivariate-normal latent variables. This model assumes that the error distribution is time dependent (with the index ). A simpler version is to make this error term invariant over time, which is then represented by the following model with constrained error variances:
 |
This constrained model is considered first. The LINEQS modeling language is used to specify this constrained model, as shown in the following statements.
   proc tcalis method=ml data=growth nostand noparmname;
      lineqs
         y1 = f_alpha              + e1,
         y2 = f_alpha  +  1 f_beta + e2,
         y3 = f_alpha  +  2 f_beta + e3,
         y4 = f_alpha  +  3 f_beta + e4,
         y5 = f_alpha  +  4 f_beta + e5;
      std
         f_alpha   = parm__,
         f_beta    = parm__,
         e1-e5     = 5 * evar;
      cov
         f_alpha f_beta = parm__;
      mean
         f_alpha   = parm__,
         f_beta    = parm__;
      fitindex on(only)=[chisq df probchi];
   run;
In the LINEQS model specification, f_alpha and f_beta are treated as latent factors representing the random intercept and random slope, respectively. The f_ prefix for latent factors is not arbitrary but is required as a convention in the LINEQS modeling language. See the sections Naming Variables in the LINEQS Model and Naming Variables and Parameters for details.
At ,  represents the initial confidence measurement so that it is not subject to the random effect f_beta. The next four measurements
  ,
,  ,
,  , and
, and  are measured at time points
  ,
,  ,
,  , and
, and  , respectively. These are fixed time points with constant values
  ,
,  ,
,  , and
, and  , respectively, in the equations of the LINEQS statement.
The means, variances and covariances of f_alpha and f_beta are parameters in the model. The variances of these two latent variables are specified in the STD statement, while their covariance is specified in the COV statement. The means of f_alpha and f_beta are specified in the MEAN statement. Notice that the parameter name parm__ is used for all these parameters. Parameter names ending with two underscores ('__') are used as generic names for generating new parameter names. Each time such a generic name is parsed, PROC TCALIS replaces the underscores with an unique integer. Therefore, in the various locations of parm__ in the LINEQS model, the actual parameter names registered with PROC TCALIS are parm1, parm2, ..., parm5. For example, the variance parameters of f_alpha and f_beta are named parm1 and parm2, respectively, and the mean parameter of f_beta is named parm5.
The error variances for e1–e5 are also specified in the STD statement. Using the shorthand notation 5 *, the parameter name evar is repeated five times for the five error variances. This implicitly constrains the error variances for e1–e5 to be equal.
Special printing options are used in this example. In the PROC TCALIS statement, the NOSTAND option is specified because standardized solution is not of interest. The reason is that  -
- were already measured on comparable scales, making standardization unnecessary for interpretations. Another printing option specified is the NOPARMNAME option in the PROC TCALIS statement. This option suppresses the printing of parameter names in the output for estimation. This makes the output look more precise when you do not need direct references to the parameter names. Still another printing option used is the ON(ONLY)= option of the FITINDEX statement. This option trims down the display of fit indices to include only those listed in the option. See the FITINDEX statement for details.
The fit summary table is shown in Output 88.7.1.
In Output 88.7.1, the chi-square value in the fit summary table is  (
( ,
,  ), which is a statistically significant result that might indicate a poor model fit. Despite that, it is illustrative to continue to look at the main estimation results, which are shown in the following table.
| Estimates for Variances of Exogenous Variables | ||||
|---|---|---|---|---|
| Variable Type |
Variable | Estimate | Standard Error |
t Value |
| Latent | f_alpha | 13.89140 | 5.81540 | 2.38873 |
| f_beta | 0.80742 | 0.42198 | 1.91342 | |
| Error | e1 | 3.32185 | 0.70031 | 4.74342 |
| e2 | 3.32185 | 0.70031 | 4.74342 | |
| e3 | 3.32185 | 0.70031 | 4.74342 | |
| e4 | 3.32185 | 0.70031 | 4.74342 | |
| e5 | 3.32185 | 0.70031 | 4.74342 | |
In Output 88.7.2, the estimated variance of the random intercept , which is represented by the variance estimate of the latent factor f_alpha, is  (
( ). In the next row of the same table, the variance estimate of the random effect , which is represented by the variance estimate of the latent factor f_beta, is
  (
( ).
).
The covariance of the random intercept and the random effect is shown in the next table for "Covariances Among Exogenous Variables." A negative estimate of  is shown. This means that the initial self-confidence level and the boosting effect of training are negatively correlated. The higher the initial self-confidence level, the smaller the training effect.
In the last table for the "Mean Parameters," the estimated mean of the random intercept is  , which is an estimate of the averaged initial self-confidence level. The estimated mean of random effect is
  , which is an estimate of the averaged training effect.
Given that the model does not fit that well, perhaps you should not take the interpretations of these estimates so seriously. Knowing that the distribution of the errors might have been time-dependent, you now try to improve the fit of the model by relaxing the constraint about common error variances. This can be done by using the following specification:
   proc tcalis method=ml data=growth nostand noparmname;
      lineqs
         y1 = f_alpha              + e1,
         y2 = f_alpha  +  1 f_beta + e2,
         y3 = f_alpha  +  2 f_beta + e3,
         y4 = f_alpha  +  3 f_beta + e4,
         y5 = f_alpha  +  4 f_beta + e5;
      std
         f_alpha   = parm__,
         f_beta    = parm__,
         e1-e5     = 5 * parm__;
      cov
         f_alpha f_beta = parm__;
      mean
         f_alpha   = parm__,
         f_beta    = parm__;
      fitindex on(only)=[chisq df probchi];
   run;
In this new specification, there is only one change in the STD statement from the previous specification. That is, you now use five different parameters for the five error variances, as highlighted in the following:
e1-e5 = 5 * parm__;
This specification is equivalent to putting parm__ five times for the five error variance parameters, which is shown as follows:
e1-e5 = parm__ parm__ parm__ parm__ parm__;
The model fit summary is shown in Output 88.7.3.
As you can see from the fit summary table, the chi-square for the unconstrained model is  (
( ,
,  ). This indicates an acceptable model fit. The chi-square difference test can also be conducted for testing the previous constrained model against this new model. The chi-square difference is
  . With
  =4, this chi-square difference value is statistically significant at =0.01, indicating a significant improvement of model fit by using the unconstrained model.
Estimation results are shown in Output 88.7.4.
| Estimates for Variances of Exogenous Variables | ||||
|---|---|---|---|---|
| Variable Type |
Variable | Estimate | Standard Error |
t Value |
| Latent | f_alpha | 14.70071 | 5.66943 | 2.59298 |
| f_beta | 0.45059 | 0.29867 | 1.50867 | |
| Error | e1 | 2.81712 | 1.35332 | 2.08164 |
| e2 | 0.32213 | 0.46118 | 0.69848 | |
| e3 | 1.94429 | 0.86824 | 2.23935 | |
| e4 | 1.88569 | 1.21306 | 1.55448 | |
| e5 | 14.65193 | 5.99354 | 2.44462 | |
The estimation results for the unconstrained model present a slightly different picture than the constrained model. While the estimates for the means and variances of the random intercept and the random training effect look similar in both models, estimates of the covariance between the random intercept and the random training effect are quite different in the two models. The covariance estimate is negative () in the constrained model, but it is positive ( ) in the unconstrained model. However, because the covariance estimates are not statistically significant in both models (
 and
and  , respectively), you wonder whether the current data are showing strong evidence that supports one way or another. To get a clearer picture, perhaps more data should be collected and the model should be fit again to check for the significance of the covariance between the random intercept and slope. If the covariance estimate is still not significant, future models might have this covariance fixed at 0 in analysis.
Note: This procedure is experimental.
Copyright © 2009 by SAS Institute Inc., Cary, NC, USA. All rights reserved.