| Statistical Graphics Using ODS |
| The Graph Template Language |
Graph template definitions begin with a DEFINE STATGRAPH statement in PROC TEMPLATE, and they end with an END statement. Embedded in every graph template is a BEGINGRAPH/ENDGRAPH block, and embedded in that block are one or more LAYOUT blocks. You can specify the DYNAMIC statement to define dynamic variables (which the procedure uses to pass values to the template definition), the MVAR and NMVAR statements to define macro variables (which you can use to pass values to the template definition), and the NOTES statement to provide descriptive information about the graph. The default templates supplied by SAS for statistical procedures are often lengthy and complex, because they provide ODS Graphics with comprehensive and detailed information about graph construction. Here is one of the simpler graph templates for a statistical procedure:
   define statgraph Stat.MDS.Graphics.Fit;
      notes "MDS Fit Plot";
      dynamic head;
      begingraph / designwidth=defaultdesignheight;
         entrytitle HEAD;
         layout overlayequated / equatetype=square;
            scatterplot y=FITDATA x=FITDIST / markerattrs=(size=5px);
            lineparm slope=1 x=0 y=0 / extend=true lineattrs=GRAPHREFERENCE;
         endlayout;
      endgraph;
   end;
This template, supplied for the MDS procedure, creates a scatter plot of two variables, FitData and FitDist, along with a diagonal reference line that passes through the origin. The plot is square and the axes are equated so that a centimeter on one axis represents the same data range as a centimeter on the other axis. The plot title is provided by the evaluation of the dynamic variable Head, which is set by the procedure. It is not unusual for this plot to contain hundreds or even thousands of points, so a five-pixel marker is specified, which is smaller than the seven-pixel marker used by default in most styles.
The statements available in the graph template language can be classified as follows:
Control statements specify the conditional or iterative flow of control. By default, flow of control is sequential. In other words, each statement is used in the order in which it appears.
Layout statements specify the arrangement of the components of the graph. Layout statements are arranged in blocks that begin with a LAYOUT statement and end with an ENDLAYOUT statement. The blocks can be nested. Within a layout block, there can be plot, text, and other statements that define one or more graph components. Options provide control for attributes of layouts and components.
Plot statements specify a number of commonly used displays, including scatter plots, histograms, contour plots, surface plots, and box plots. Plot statements are always provided within a layout block. The plot statements include options to specify the data columns from the source objects that are used in the graph. For example, in the SCATTERPLOT statement, there are mandatory X= and Y= arguments that specify which data columns are used for the X (horizontal) and Y (vertical) axes in the plot. (In the preceding example, FitData and FitDist are the names of columns int the data object that PROC MDS creates for this graph.) There is also a GROUP= option that specifies a data column as an optional classification variable.
Text statements specify the descriptions that accompany graphs. An entry is any textual description, including titles, footnotes, and legends; it can include symbols to identify graph elements.
The following statements display another of the simpler template definitions—the definition of the scatter plot available in PROC KDE (see Figure 45.6.1 in Chapter 45, The KDE Procedure ):
   proc template;
      define statgraph Stat.KDE.Graphics.ScatterPlot;
         dynamic _TITLE _DEPLABEL _DEPLABEL2;
         BeginGraph;
            EntryTitle _TITLE;
            layout Overlay;
               scatterplot x=X y=Y / markerattrs=GRAPHDATADEFAULT;
            EndLayout;
         EndGraph;
      end;
   run;
Here, the PROC TEMPLATE and RUN statements have been added to show how you would compile the template if you wanted to modify it. The DEFINE STATGRAPH statement in PROC TEMPLATE begins the graph template definition, and the END statement ends the definition. The DYNAMIC statement defines three dynamic variables that PROC KDE sets at run time. The variable _Title provides the title of the graph. The variables _DepLabel and _DepLabel2 contain the names of the X- and Y-variables, respectively. If you were to modify this template, you could use these dynamic text variables in any text element of the graph definition.
The overall display is specified with the LAYOUT OVERLAY statement inside the BEGINGRAPH/ENDGRAPH block. The title of the graph is specified with the ENTRYTITLE statement. The main plot is a scatter plot specified with the SCATTERPLOT statement. The options in the SCATTERPLOT statement are given after the slash and specify display options such as marker attributes (symbol, color, and size). These attributes can be specified directly, as in the PROC MDS template, or more typically by using indirect references to style attributes, as in the PROC KDE template. The values of these attributes are specified in the definition of the style you are using and are automatically set to different values if you specify a different style. For more information about style references, see the section Styles. The ENDLAYOUT statement ends the main layout block. For details about the syntax of the graph template language, see the SAS/GRAPH Template Language Reference.
You can write your own templates and use them to display raw data or output from procedures. For example, consider the iris data from Example 31.1 of
Chapter 31,
The DISCRIM Procedure.
The following statements create the SAS data set:
   proc format;
      value specname
         1='Setosa    '
         2='Versicolor'
         3='Virginica ';
   run;

   data iris;
      input SepalLength SepalWidth PetalLength PetalWidth
            Species @@;
      format Species specname.;
      label SepalLength='Sepal Length in mm.'
            SepalWidth ='Sepal Width in mm.'
            PetalLength='Petal Length in mm.'
            PetalWidth ='Petal Width in mm.';
      datalines;
   50 33 14 02 1 64 28 56 22 3 65 28 46 15 2 67 31 56 24 3

   ... more lines ...

   ;
The following statements create a template for a scatter plot of the variables PetalLength and PetalWidth with a legend:
proc template;
define statgraph scatter;
begingraph;
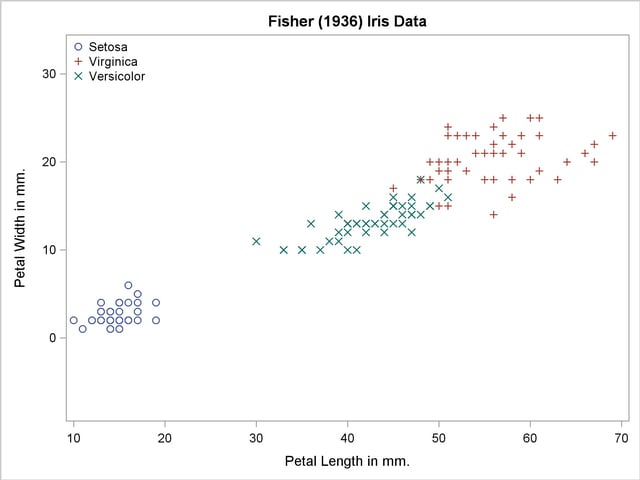
entrytitle 'Fisher (1936) Iris Data';
layout overlayequated / equatetype=fit;
scatterplot x=petallength y=petalwidth /
group=species name='iris';
layout gridded / autoalign=(topleft);
discretelegend 'iris' / border=false opaque=false;
endlayout;
endlayout;
endgraph;
end;
run;
The layout is OVERLAYEQUATED, which equates the plot. However, unlike the PROC MDS template, which used EQUATETYPE=SQUARE to make a square plot, the EQUATETYPE=FIT option specifies that the lengths of the axes in this plot should fill the entire plotting area. A legend is placed internally in the top-left portion of the plot. There are three groups of observations, indicated by the three species, and each group is plotted with a separate color and symbol that depends on the ODS style. The legend identifies each group. The NAME= option provides the link between the SCATTERPLOT statement and the DISCRETELEGEND statement. An explicit link is needed since some graphical displays are based on multiple SCATTERPLOT statements or other plotting statements.
The following step creates the plot by using the SGRENDER procedure, the Iris data set, and the custom template scatter:
   proc sgrender data=iris template=scatter;
   run;
The syntax of PROC SGRENDER is very simple, because all of the graphical options appear in the template. The scatter plot in Figure 21.32 shows the results.
The intent of this example is to illustrate how you can write a template to create a scatterplot. PROC TEMPLATE and PROC SGRENDER provide you with the power to create highly customized displays. However, usually you can use the SGPLOT, SGSCATTER or SGPANEL procedures instead, which are much simpler to use. These procedures are discussed in section Statistical Graphics Procedures. See the section Grouped Scatter Plot with PROC SGPLOT and Figure 21.12 for an example that plots these data with PROC SGPLOT.
Copyright © 2009 by SAS Institute Inc., Cary, NC, USA. All rights reserved.