|
|
Example 31.1 Univariate Density Estimates and Posterior Probabilities
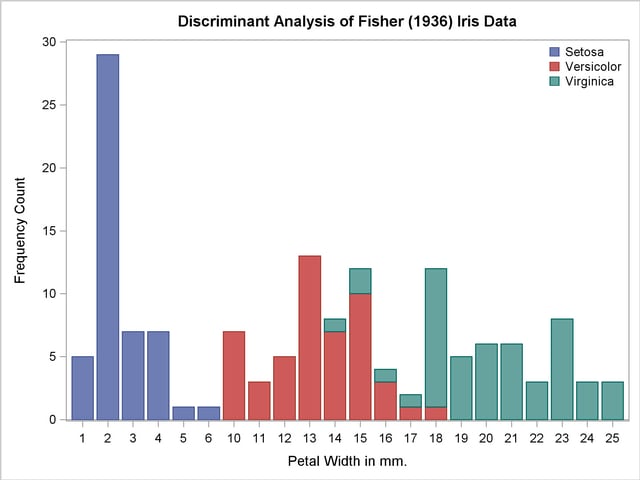
In this example, several discriminant analyses are run with a single quantitative variable, petal width, so that density estimates and posterior probabilities can be plotted easily. The example produces Output 31.1.1 through Output 31.1.5. ODS Graphics is used to display the sample distribution of petal width in the three species. For general information about ODS Graphics, see
Chapter 21,
Statistical Graphics Using ODS.
Note the overlap between the species I. versicolor and I. virginica that the bar chart shows. The following statements produce Output 31.1.1:
   title 'Discriminant Analysis of Fisher (1936) Iris Data';

   proc format;
      value specname
         1='Setosa    '
         2='Versicolor'
         3='Virginica ';
   run;

   data iris;
      input SepalLength SepalWidth PetalLength PetalWidth
            Species @@;
      format Species specname.;
      label SepalLength='Sepal Length in mm.'
            SepalWidth ='Sepal Width in mm.'
            PetalLength='Petal Length in mm.'
            PetalWidth ='Petal Width in mm.';
      datalines;
   50 33 14 02 1 64 28 56 22 3 65 28 46 15 2 67 31 56 24 3
   63 28 51 15 3 46 34 14 03 1 69 31 51 23 3 62 22 45 15 2
   59 32 48 18 2 46 36 10 02 1 61 30 46 14 2 60 27 51 16 2

   ... more lines ...

   63 33 60 25 3 53 37 15 02 1
   ;
   proc freq data=iris noprint;
      tables petalwidth * species / out=freqout;
   run;

   proc sgplot data=freqout;
      vbar petalwidth / response=count group=species;
      keylegend / location=inside position=ne noborder across=1;
   run;
Output 31.1.1
Sample Distribution of Petal Width in Three Species
In order to plot the density estimates and posterior probabilities, a data set called plotdata is created containing equally spaced values from –5 to 30, covering the range of petal width with a little to spare on each end. The plotdata data set is used with the TESTDATA= option in PROC DISCRIM. The following statements make the data set:
   data plotdata;
      do PetalWidth=-5 to 30 by 0.5;
         output;
      end;
   run;
The same plots are produced after each discriminant analysis, so macros are used to reduce the amount of typing required. The macros use two data sets. The data set plotd, containing density estimates, is created by the TESTOUTD= option in PROC DISCRIM. The data set plotp, containing posterior probabilities, is created by the TESTOUT= option. For each data set, the macros remove uninteresting values (near zero) and create an overlay plot showing all three species in a single plot.
The following statements create the macros:
   %macro plotden;
      title3 'Plot of Estimated Densities';

      data plotd2;
         set plotd;
         if setosa     < .002 then setosa     = .;
         if versicolor < .002 then versicolor = .;
         if virginica  < .002 then virginica  = .;
         g = 'Setosa    '; Density = setosa;     output;
         g = 'Versicolor'; Density = versicolor; output;
         g = 'Virginica '; Density = virginica;  output;
         label PetalWidth='Petal Width in mm.';
      run;

      proc sgplot data=plotd2;
         series y=Density x=PetalWidth / group=g;
         discretelegend;
      run;
      %mend;

   %macro plotprob;
      title3 'Plot of Posterior Probabilities';

      data plotp2;
         set plotp;
         if setosa     < .01 then setosa     = .;
         if versicolor < .01 then versicolor = .;
         if virginica  < .01 then virginica  = .;
         g = 'Setosa    '; Probability = setosa;     output;
         g = 'Versicolor'; Probability = versicolor; output;
         g = 'Virginica '; Probability = virginica;  output;
         label PetalWidth='Petal Width in mm.';
      run;

      proc sgplot data=plotp2;
         series y=Probability x=PetalWidth / group=g;
         discretelegend;
      run;
   %mend;
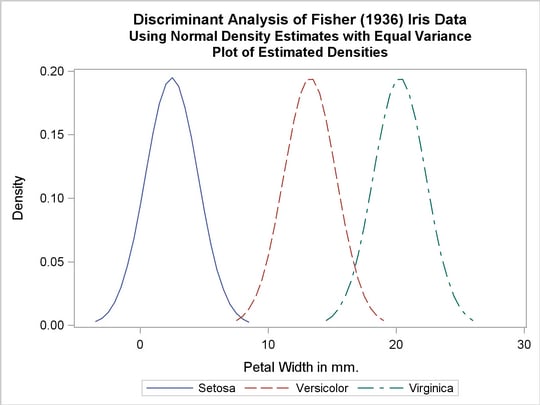
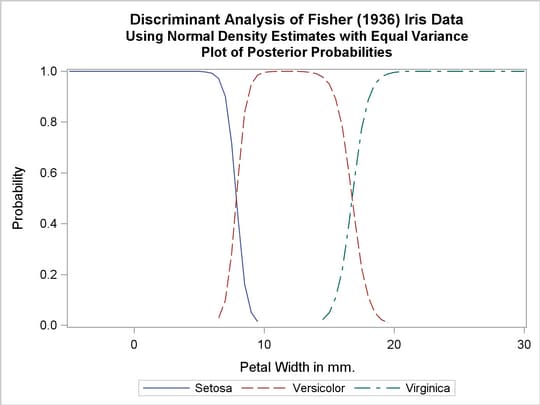
The first analysis uses normal-theory methods (METHOD=NORMAL) assuming equal variances (POOL=YES) in the three classes. The NOCLASSIFY option suppresses the resubstitution classification results of the input data set observations. The CROSSLISTERR option lists the observations that are misclassified under cross validation and displays cross validation error-rate estimates. The following statements produce Output 31.1.2:
   title2 'Using Normal Density Estimates with Equal Variance';

   proc discrim data=iris method=normal pool=yes
                testdata=plotdata testout=plotp testoutd=plotd
                short noclassify crosslisterr;
      class Species;
      var PetalWidth;
   run;

   %plotden;
   %plotprob;
Output 31.1.2
Normal Density Estimates with Equal Variance
| Setosa |
50 |
50.0000 |
0.333333 |
0.333333 |
| Versicolor |
50 |
50.0000 |
0.333333 |
0.333333 |
| Virginica |
50 |
50.0000 |
0.333333 |
0.333333 |
The DISCRIM Procedure
Classification Results for Calibration Data: WORK.IRIS
Cross-validation Results using Linear Discriminant Function
| * |
0.0000 |
0.9610 |
0.0390 |
| * |
0.0000 |
0.0952 |
0.9048 |
| * |
0.0000 |
0.9940 |
0.0060 |
| * |
0.0000 |
0.8009 |
0.1991 |
| * |
0.0000 |
0.9610 |
0.0390 |
| * |
0.0000 |
0.3828 |
0.6172 |
* Misclassified observation
The DISCRIM Procedure
Classification Summary for Calibration Data: WORK.IRIS
Cross-validation Summary using Linear Discriminant Function
| 0.0000 |
0.0400 |
0.0800 |
0.0400 |
| 0.3333 |
0.3333 |
0.3333 |
|
The DISCRIM Procedure
Classification Summary for Test Data: WORK.PLOTDATA
Classification Summary using Linear Discriminant Function
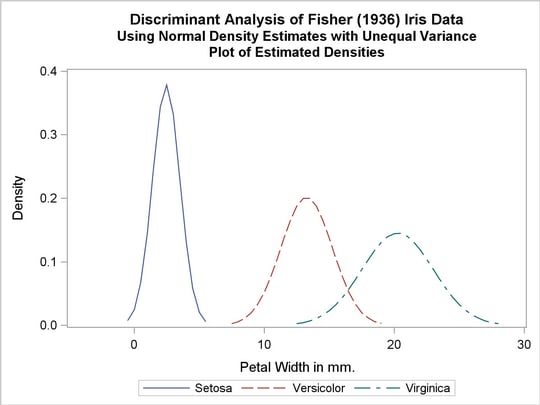
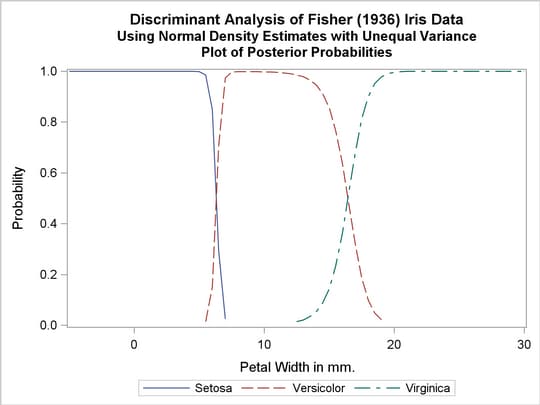
The next analysis uses normal-theory methods assuming unequal variances (POOL=NO) in the three classes. The following statements produce Output 31.1.3:
   title2 'Using Normal Density Estimates with Unequal Variance';

   proc discrim data=iris method=normal pool=no
                testdata=plotdata testout=plotp testoutd=plotd
                short noclassify crosslisterr;
      class Species;
      var PetalWidth;
   run;

   %plotden;
   %plotprob;
Output 31.1.3
Normal Density Estimates with Unequal Variance
| Setosa |
50 |
50.0000 |
0.333333 |
0.333333 |
| Versicolor |
50 |
50.0000 |
0.333333 |
0.333333 |
| Virginica |
50 |
50.0000 |
0.333333 |
0.333333 |
The DISCRIM Procedure
Classification Results for Calibration Data: WORK.IRIS
Cross-validation Results using Quadratic Discriminant Function
| * |
0.0000 |
0.8740 |
0.1260 |
| * |
0.0000 |
0.0686 |
0.9314 |
| * |
0.4923 |
0.5073 |
0.0004 |
| * |
0.0000 |
0.9602 |
0.0398 |
| * |
0.0000 |
0.6558 |
0.3442 |
| * |
0.0000 |
0.8740 |
0.1260 |
| * |
0.0000 |
0.2871 |
0.7129 |
* Misclassified observation
The DISCRIM Procedure
Classification Summary for Calibration Data: WORK.IRIS
Cross-validation Summary using Quadratic Discriminant Function
| 0.0200 |
0.0400 |
0.0800 |
0.0467 |
| 0.3333 |
0.3333 |
0.3333 |
|
The DISCRIM Procedure
Classification Summary for Test Data: WORK.PLOTDATA
Classification Summary using Quadratic Discriminant Function
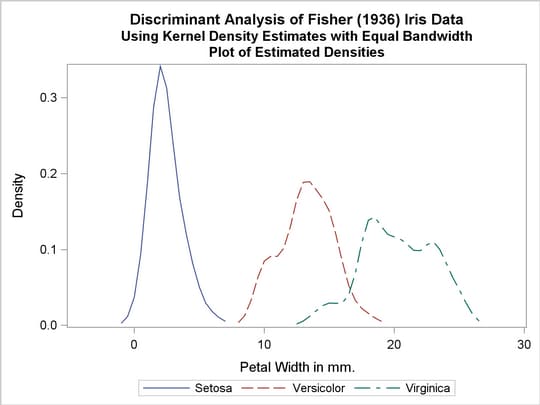
Two more analyses are run with nonparametric methods (METHOD=NPAR), specifically kernel density estimates with normal kernels (KERNEL=NORMAL). The first of these uses equal bandwidths (smoothing parameters) (POOL=YES) in each class. The use of equal bandwidths does not constrain the density estimates to be of equal variance. The value of the radius parameter that, assuming normality, minimizes an approximate mean integrated square error is  (see the section Nonparametric Methods). Choosing
  gives a more detailed look at the irregularities in the data. The following statements produce Output 31.1.4:
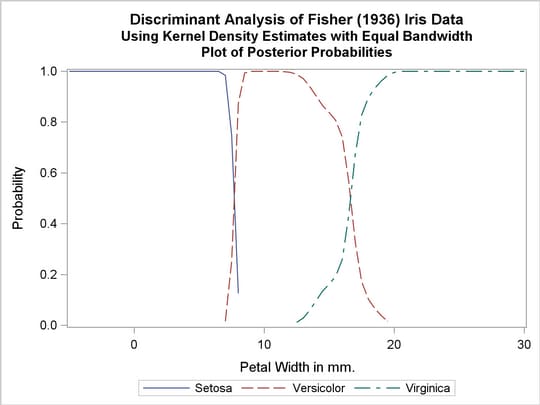
   title2 'Using Kernel Density Estimates with Equal Bandwidth';

   proc discrim data=iris method=npar kernel=normal
                   r=.4 pool=yes
                testdata=plotdata testout=plotp
                   testoutd=plotd
                short noclassify crosslisterr;
      class Species;
      var PetalWidth;
   run;

   %plotden;
   %plotprob;
Output 31.1.4
Kernel Density Estimates with Equal Bandwidth
| Setosa |
50 |
50.0000 |
0.333333 |
0.333333 |
| Versicolor |
50 |
50.0000 |
0.333333 |
0.333333 |
| Virginica |
50 |
50.0000 |
0.333333 |
0.333333 |
The DISCRIM Procedure
Classification Results for Calibration Data: WORK.IRIS
Cross-validation Results using Normal Kernel Density
| * |
0.0000 |
0.8827 |
0.1173 |
| * |
0.0000 |
0.0438 |
0.9562 |
| * |
0.0000 |
0.9472 |
0.0528 |
| * |
0.0000 |
0.8061 |
0.1939 |
| * |
0.0000 |
0.8827 |
0.1173 |
| * |
0.0000 |
0.2586 |
0.7414 |
* Misclassified observation
The DISCRIM Procedure
Classification Summary for Calibration Data: WORK.IRIS
Cross-validation Summary using Normal Kernel Density
| 0.0000 |
0.0400 |
0.0800 |
0.0400 |
| 0.3333 |
0.3333 |
0.3333 |
|
The DISCRIM Procedure
Classification Summary for Test Data: WORK.PLOTDATA
Classification Summary using Normal Kernel Density
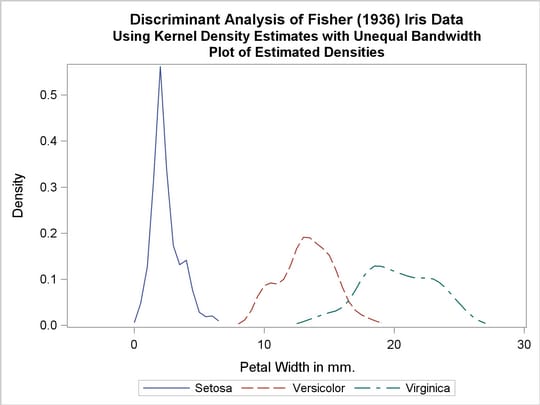
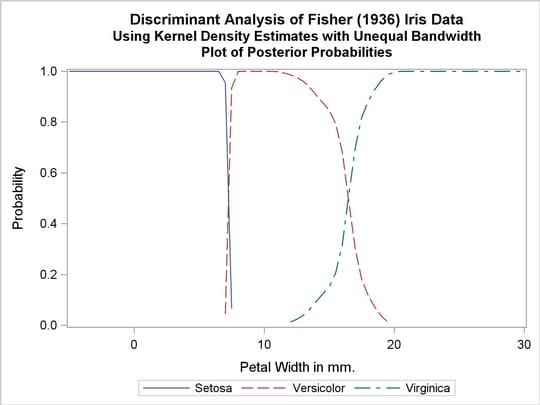
Another nonparametric analysis is run with unequal bandwidths (POOL=NO). The following statements produce Output 31.1.5:
   title2 'Using Kernel Density Estimates with Unequal Bandwidth';

   proc discrim data=iris method=npar kernel=normal
                   r=.4 pool=no
                testdata=plotdata testout=plotp
                   testoutd=plotd
                short noclassify crosslisterr;
      class Species;
      var PetalWidth;
   run;

   %plotden;
   %plotprob;
Output 31.1.5
Kernel Density Estimates with Unequal Bandwidth
| Setosa |
50 |
50.0000 |
0.333333 |
0.333333 |
| Versicolor |
50 |
50.0000 |
0.333333 |
0.333333 |
| Virginica |
50 |
50.0000 |
0.333333 |
0.333333 |
The DISCRIM Procedure
Classification Results for Calibration Data: WORK.IRIS
Cross-validation Results using Normal Kernel Density
| * |
0.0000 |
0.8805 |
0.1195 |
| * |
0.0000 |
0.0466 |
0.9534 |
| * |
0.0000 |
0.9394 |
0.0606 |
| * |
0.0000 |
0.7193 |
0.2807 |
| * |
0.0000 |
0.8805 |
0.1195 |
| * |
0.0000 |
0.2275 |
0.7725 |
* Misclassified observation
The DISCRIM Procedure
Classification Summary for Calibration Data: WORK.IRIS
Cross-validation Summary using Normal Kernel Density
| 0.0000 |
0.0400 |
0.0800 |
0.0400 |
| 0.3333 |
0.3333 |
0.3333 |
|
The DISCRIM Procedure
Classification Summary for Test Data: WORK.PLOTDATA
Classification Summary using Normal Kernel Density
Copyright
© 2009 by SAS Institute Inc., Cary, NC, USA. All
rights reserved.