| Statistical Graphics Using ODS |
| Survival Estimate Plot with PROC LIFETEST |
This example is taken from Example 49.2 of Chapter 49, The LIFETEST Procedure. It shows how to construct a product-limit survival estimate plot. Both the ODS GRAPHICS statement and procedure options are used to request the plot.
The following statements create a SAS data set with disease-free times for three risk categories:
   proc format;
      value risk 1='ALL' 2='AML-Low Risk' 3='AML-High Risk';
   run;

   data BMT;
      input Group T Status @@;
      format Group risk.;
      label T='Disease Free Time';
      datalines;
   1 2081 0 1 1602 0 1 1496 0 1 1462 0 1 1433 0

   ... more lines ...

   ;
The following statements use PROC LIFETEST to compute the product-limit estimate of the survivor function for each risk category:
   ods graphics on;

   proc lifetest data=BMT plots=survival(cb=hw test);
      time T * Status(0);
      strata Group / test=logrank;
   run;
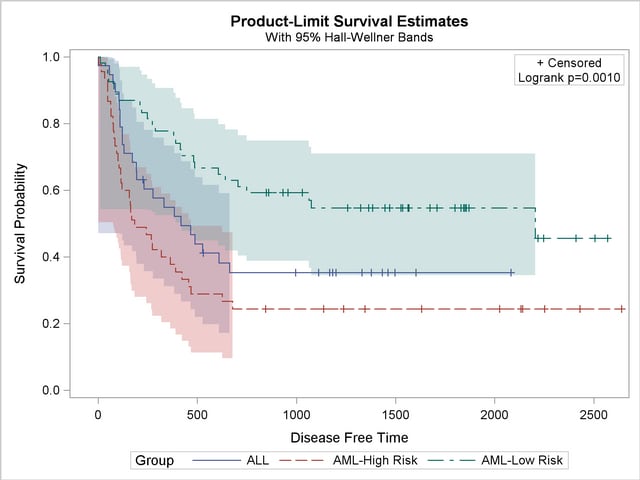
The ODS GRAPHICS ON statement requests ODS Graphics functionality, and the PLOTS=SURVIVAL option requests a plot of the estimated survival curves. The CB=HW suboption requests Hall-Wellner confidence bands, and the TEST suboption displays the p-value for the log-rank test in a plot inset.
Figure 21.4 displays the plot; note that tabular output is not shown. The results are displayed in the STATISTICAL style. Patients in the AML-Low Risk group are disease-free longer than those in the ALL group, who in turn fare better than those in the AML-High Risk group.
Copyright © 2009 by SAS Institute Inc., Cary, NC, USA. All rights reserved.