| The LIFETEST Procedure |
Example 49.1 Product-Limit Estimates and Tests of Association
The data presented in Appendix I of Kalbfleisch and Prentice (1980) are coded in the following DATA step. The response variable, SurvTime, is the survival time in days of a lung cancer patient. Negative values of SurvTime are censored values. The covariates are Cell (type of cancer cell), Therapy (type of therapy: standard or test), Prior (prior therapy: 0=no, 10=yes), Age (age in years), DiagTime (time in months from diagnosis to entry into the trial), and Kps (performance status). A censoring indicator variable Censor is created from the data, with the value 1 indicating a censored time and the value 0 indicating an event time. Since there are only two types of therapy, an indicator variable, Treatment, is constructed for therapy type, with value 0 for standard therapy and value 1 for test therapy.
   data VALung;
      drop check m;
      retain Therapy Cell;
      infile cards column=column;
      length Check $ 1;
      label SurvTime='failure or censoring time'
         Kps='karnofsky index'
         DiagTime='months till randomization'
         Age='age in years'
         Prior='prior treatment?'
         Cell='cell type'
         Therapy='type of treatment'
         Treatment='treatment indicator';
      M=Column;
      input Check $ @@;
      if M>Column then M=1;
      if Check='s'|Check='t' then input @M Therapy $ Cell $ ;
      else input @M SurvTime Kps DiagTime Age Prior @@;
      if SurvTime > .;
      censor=(SurvTime<0);
      SurvTime=abs(SurvTime);
      Treatment=(Therapy='test');
      dataline;
   standard squamous
    72 60  7 69  0   411 70  5 64 10   228 60  3 38  0   126 60  9 63 10
   118 70 11 65 10    10 20  5 49  0    82 40 10 69 10   110 80 29 68  0
   314 50 18 43  0  -100 70  6 70  0    42 60  4 81  0     8 40 58 63 10
   144 30  4 63  0   -25 80  9 52 10    11 70 11 48 10
   standard small
    30 60  3 61  0   384 60  9 42  0     4 40  2 35  0    54 80  4 63 10
    13 60  4 56  0  -123 40  3 55  0   -97 60  5 67  0   153 60 14 63 10
    59 30  2 65  0   117 80  3 46  0    16 30  4 53 10   151 50 12 69  0
    22 60  4 68  0    56 80 12 43 10    21 40  2 55 10    18 20 15 42  0
   139 80  2 64  0    20 30  5 65  0    31 75  3 65  0    52 70  2 55  0
   287 60 25 66 10    18 30  4 60  0    51 60  1 67  0   122 80 28 53  0
    27 60  8 62  0    54 70  1 67  0     7 50  7 72  0    63 50 11 48  0
   392 40  4 68  0    10 40 23 67 10
   standard adeno
     8 20 19 61 10    92 70 10 60  0    35 40  6 62  0   117 80  2 38  0
   132 80  5 50  0    12 50  4 63 10   162 80  5 64  0     3 30  3 43  0
    95 80  4 34  0
   standard large
   177 50 16 66 10   162 80  5 62  0   216 50 15 52  0   553 70  2 47  0
   278 60 12 63  0    12 40 12 68 10   260 80  5 45  0   200 80 12 41 10
   156 70  2 66  0  -182 90  2 62  0   143 90  8 60  0   105 80 11 66  0
   103 80  5 38  0   250 70  8 53 10   100 60 13 37 10
   test squamous
   999 90 12 54 10   112 80  6 60  0   -87 80  3 48  0  -231 50  8 52 10
   242 50  1 70  0   991 70  7 50 10   111 70  3 62  0     1 20 21 65 10
   587 60  3 58  0   389 90  2 62  0    33 30  6 64  0    25 20 36 63  0
   357 70 13 58  0   467 90  2 64  0   201 80 28 52 10     1 50  7 35  0
    30 70 11 63  0    44 60 13 70 10   283 90  2 51  0    15 50 13 40 10
   test small
    25 30  2 69  0  -103 70 22 36 10    21 20  4 71  0    13 30  2 62  0
    87 60  2 60  0     2 40 36 44 10    20 30  9 54 10     7 20 11 66  0
    24 60  8 49  0    99 70  3 72  0     8 80  2 68  0    99 85  4 62  0
    61 70  2 71  0    25 70  2 70  0    95 70  1 61  0    80 50 17 71  0
    51 30 87 59 10    29 40  8 67  0
   test adeno
    24 40  2 60  0    18 40  5 69 10   -83 99  3 57  0    31 80  3 39  0
    51 60  5 62  0    90 60 22 50 10    52 60  3 43  0    73 60  3 70  0
     8 50  5 66  0    36 70  8 61  0    48 10  4 81  0     7 40  4 58  0
   140 70  3 63  0   186 90  3 60  0    84 80  4 62 10    19 50 10 42  0
    45 40  3 69  0    80 40  4 63  0
   test large
    52 60  4 45  0   164 70 15 68 10    19 30  4 39 10    53 60 12 66  0
    15 30  5 63  0    43 60 11 49 10   340 80 10 64 10   133 75  1 65  0
   111 60  5 64  0   231 70 18 67 10   378 80  4 65  0    49 30  3 37  0
   ;
In the following statements, PROC LIFETEST is invoked to compute the product-limit estimate of the survivor function for each type of cancer cell and to analyze the effects of the variables Age, Prior, DiagTime, Kps, and Treatment on the survival of the patients. These prognostic factors are specified in the TEST statement, and the variable Cell is specified in the STRATA statement. Graphics results are enabled through ODS with the specification of the ods graphics on statement. Graphical display of the product-limit estimates (S), the negative log estimates (LS), and the log of negative log estimates (LLS) are requested through the PLOTS= option in the PROC LIFETEST statement. Because of a few large survival times, a MAXTIME of 600 is used to set the scale of the time axis; that is, the time scale extends from 0 to a maximum of 600 days in the plots. The variable Therapy is specified in the ID statement to identify the type of therapy for each observation in the product-limit estimates. The OUTTEST option specifies the creation of an output data set named Test to contain the rank test matrices for the covariates.
   ods graphics on;
   proc lifetest data=VALung plots=(s,ls,lls) outtest=Test maxtime=600;
      time SurvTime*Censor(1);
      id Therapy;
      strata Cell;
      test Age Prior DiagTime Kps Treatment;
   run;
   ods graphics off;
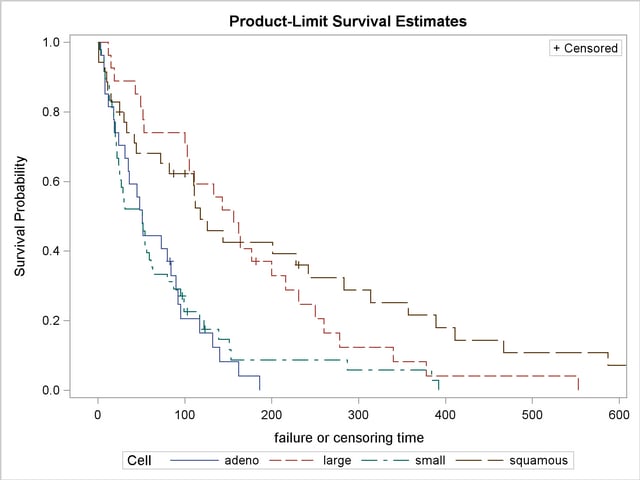
Output 49.1.1 through Output 49.1.4 display the product-limit estimates of the survivor functions for the four cell types. Summary statistics of the survival times are also shown. The median survival times are 51 days, 156 days, 51 days, and 118 days for patients with adeno cells, large cells, small cells, and squamous cells, respectively.
| Product-Limit Survival Estimates | |||||||
|---|---|---|---|---|---|---|---|
| SurvTime | Survival | Failure | Survival Standard Error |
Number Failed |
Number Left |
Therapy | |
| 0.000 | 1.0000 | 0 | 0 | 0 | 27 | ||
| 3.000 | 0.9630 | 0.0370 | 0.0363 | 1 | 26 | standard | |
| 7.000 | 0.9259 | 0.0741 | 0.0504 | 2 | 25 | test | |
| 8.000 | . | . | . | 3 | 24 | standard | |
| 8.000 | 0.8519 | 0.1481 | 0.0684 | 4 | 23 | test | |
| 12.000 | 0.8148 | 0.1852 | 0.0748 | 5 | 22 | standard | |
| 18.000 | 0.7778 | 0.2222 | 0.0800 | 6 | 21 | test | |
| 19.000 | 0.7407 | 0.2593 | 0.0843 | 7 | 20 | test | |
| 24.000 | 0.7037 | 0.2963 | 0.0879 | 8 | 19 | test | |
| 31.000 | 0.6667 | 0.3333 | 0.0907 | 9 | 18 | test | |
| 35.000 | 0.6296 | 0.3704 | 0.0929 | 10 | 17 | standard | |
| 36.000 | 0.5926 | 0.4074 | 0.0946 | 11 | 16 | test | |
| 45.000 | 0.5556 | 0.4444 | 0.0956 | 12 | 15 | test | |
| 48.000 | 0.5185 | 0.4815 | 0.0962 | 13 | 14 | test | |
| 51.000 | 0.4815 | 0.5185 | 0.0962 | 14 | 13 | test | |
| 52.000 | 0.4444 | 0.5556 | 0.0956 | 15 | 12 | test | |
| 73.000 | 0.4074 | 0.5926 | 0.0946 | 16 | 11 | test | |
| 80.000 | 0.3704 | 0.6296 | 0.0929 | 17 | 10 | test | |
| 83.000 | * | . | . | . | 17 | 9 | test |
| 84.000 | 0.3292 | 0.6708 | 0.0913 | 18 | 8 | test | |
| 90.000 | 0.2881 | 0.7119 | 0.0887 | 19 | 7 | test | |
| 92.000 | 0.2469 | 0.7531 | 0.0850 | 20 | 6 | standard | |
| 95.000 | 0.2058 | 0.7942 | 0.0802 | 21 | 5 | standard | |
| 117.000 | 0.1646 | 0.8354 | 0.0740 | 22 | 4 | standard | |
| 132.000 | 0.1235 | 0.8765 | 0.0659 | 23 | 3 | standard | |
| 140.000 | 0.0823 | 0.9177 | 0.0553 | 24 | 2 | test | |
| 162.000 | 0.0412 | 0.9588 | 0.0401 | 25 | 1 | standard | |
| 186.000 | 0 | 1.0000 | . | 26 | 0 | test | |
| Note: | The marked survival times are censored observations. |
| Product-Limit Survival Estimates | |||||||
|---|---|---|---|---|---|---|---|
| SurvTime | Survival | Failure | Survival Standard Error |
Number Failed |
Number Left |
Therapy | |
| 0.000 | 1.0000 | 0 | 0 | 0 | 27 | ||
| 12.000 | 0.9630 | 0.0370 | 0.0363 | 1 | 26 | standard | |
| 15.000 | 0.9259 | 0.0741 | 0.0504 | 2 | 25 | test | |
| 19.000 | 0.8889 | 0.1111 | 0.0605 | 3 | 24 | test | |
| 43.000 | 0.8519 | 0.1481 | 0.0684 | 4 | 23 | test | |
| 49.000 | 0.8148 | 0.1852 | 0.0748 | 5 | 22 | test | |
| 52.000 | 0.7778 | 0.2222 | 0.0800 | 6 | 21 | test | |
| 53.000 | 0.7407 | 0.2593 | 0.0843 | 7 | 20 | test | |
| 100.000 | 0.7037 | 0.2963 | 0.0879 | 8 | 19 | standard | |
| 103.000 | 0.6667 | 0.3333 | 0.0907 | 9 | 18 | standard | |
| 105.000 | 0.6296 | 0.3704 | 0.0929 | 10 | 17 | standard | |
| 111.000 | 0.5926 | 0.4074 | 0.0946 | 11 | 16 | test | |
| 133.000 | 0.5556 | 0.4444 | 0.0956 | 12 | 15 | test | |
| 143.000 | 0.5185 | 0.4815 | 0.0962 | 13 | 14 | standard | |
| 156.000 | 0.4815 | 0.5185 | 0.0962 | 14 | 13 | standard | |
| 162.000 | 0.4444 | 0.5556 | 0.0956 | 15 | 12 | standard | |
| 164.000 | 0.4074 | 0.5926 | 0.0946 | 16 | 11 | test | |
| 177.000 | 0.3704 | 0.6296 | 0.0929 | 17 | 10 | standard | |
| 182.000 | * | . | . | . | 17 | 9 | standard |
| 200.000 | 0.3292 | 0.6708 | 0.0913 | 18 | 8 | standard | |
| 216.000 | 0.2881 | 0.7119 | 0.0887 | 19 | 7 | standard | |
| 231.000 | 0.2469 | 0.7531 | 0.0850 | 20 | 6 | test | |
| 250.000 | 0.2058 | 0.7942 | 0.0802 | 21 | 5 | standard | |
| 260.000 | 0.1646 | 0.8354 | 0.0740 | 22 | 4 | standard | |
| 278.000 | 0.1235 | 0.8765 | 0.0659 | 23 | 3 | standard | |
| 340.000 | 0.0823 | 0.9177 | 0.0553 | 24 | 2 | test | |
| 378.000 | 0.0412 | 0.9588 | 0.0401 | 25 | 1 | test | |
| 553.000 | 0 | 1.0000 | . | 26 | 0 | standard | |
| Note: | The marked survival times are censored observations. |
| Product-Limit Survival Estimates | |||||||
|---|---|---|---|---|---|---|---|
| SurvTime | Survival | Failure | Survival Standard Error |
Number Failed |
Number Left |
Therapy | |
| 0.000 | 1.0000 | 0 | 0 | 0 | 48 | ||
| 2.000 | 0.9792 | 0.0208 | 0.0206 | 1 | 47 | test | |
| 4.000 | 0.9583 | 0.0417 | 0.0288 | 2 | 46 | standard | |
| 7.000 | . | . | . | 3 | 45 | standard | |
| 7.000 | 0.9167 | 0.0833 | 0.0399 | 4 | 44 | test | |
| 8.000 | 0.8958 | 0.1042 | 0.0441 | 5 | 43 | test | |
| 10.000 | 0.8750 | 0.1250 | 0.0477 | 6 | 42 | standard | |
| 13.000 | . | . | . | 7 | 41 | standard | |
| 13.000 | 0.8333 | 0.1667 | 0.0538 | 8 | 40 | test | |
| 16.000 | 0.8125 | 0.1875 | 0.0563 | 9 | 39 | standard | |
| 18.000 | . | . | . | 10 | 38 | standard | |
| 18.000 | 0.7708 | 0.2292 | 0.0607 | 11 | 37 | standard | |
| 20.000 | . | . | . | 12 | 36 | standard | |
| 20.000 | 0.7292 | 0.2708 | 0.0641 | 13 | 35 | test | |
| 21.000 | . | . | . | 14 | 34 | standard | |
| 21.000 | 0.6875 | 0.3125 | 0.0669 | 15 | 33 | test | |
| 22.000 | 0.6667 | 0.3333 | 0.0680 | 16 | 32 | standard | |
| 24.000 | 0.6458 | 0.3542 | 0.0690 | 17 | 31 | test | |
| 25.000 | . | . | . | 18 | 30 | test | |
| 25.000 | 0.6042 | 0.3958 | 0.0706 | 19 | 29 | test | |
| 27.000 | 0.5833 | 0.4167 | 0.0712 | 20 | 28 | standard | |
| 29.000 | 0.5625 | 0.4375 | 0.0716 | 21 | 27 | test | |
| 30.000 | 0.5417 | 0.4583 | 0.0719 | 22 | 26 | standard | |
| 31.000 | 0.5208 | 0.4792 | 0.0721 | 23 | 25 | standard | |
| 51.000 | . | . | . | 24 | 24 | standard | |
| 51.000 | 0.4792 | 0.5208 | 0.0721 | 25 | 23 | test | |
| 52.000 | 0.4583 | 0.5417 | 0.0719 | 26 | 22 | standard | |
| 54.000 | . | . | . | 27 | 21 | standard | |
| 54.000 | 0.4167 | 0.5833 | 0.0712 | 28 | 20 | standard | |
| 56.000 | 0.3958 | 0.6042 | 0.0706 | 29 | 19 | standard | |
| 59.000 | 0.3750 | 0.6250 | 0.0699 | 30 | 18 | standard | |
| 61.000 | 0.3542 | 0.6458 | 0.0690 | 31 | 17 | test | |
| 63.000 | 0.3333 | 0.6667 | 0.0680 | 32 | 16 | standard | |
| 80.000 | 0.3125 | 0.6875 | 0.0669 | 33 | 15 | test | |
| 87.000 | 0.2917 | 0.7083 | 0.0656 | 34 | 14 | test | |
| 95.000 | 0.2708 | 0.7292 | 0.0641 | 35 | 13 | test | |
| 97.000 | * | . | . | . | 35 | 12 | standard |
| 99.000 | . | . | . | 36 | 11 | test | |
| 99.000 | 0.2257 | 0.7743 | 0.0609 | 37 | 10 | test | |
| 103.000 | * | . | . | . | 37 | 9 | test |
| 117.000 | 0.2006 | 0.7994 | 0.0591 | 38 | 8 | standard | |
| 122.000 | 0.1755 | 0.8245 | 0.0567 | 39 | 7 | standard | |
| 123.000 | * | . | . | . | 39 | 6 | standard |
| 139.000 | 0.1463 | 0.8537 | 0.0543 | 40 | 5 | standard | |
| 151.000 | 0.1170 | 0.8830 | 0.0507 | 41 | 4 | standard | |
| 153.000 | 0.0878 | 0.9122 | 0.0457 | 42 | 3 | standard | |
| 287.000 | 0.0585 | 0.9415 | 0.0387 | 43 | 2 | standard | |
| 384.000 | 0.0293 | 0.9707 | 0.0283 | 44 | 1 | standard | |
| 392.000 | 0 | 1.0000 | . | 45 | 0 | standard | |
| Note: | The marked survival times are censored observations. |
| Product-Limit Survival Estimates | |||||||
|---|---|---|---|---|---|---|---|
| SurvTime | Survival | Failure | Survival Standard Error |
Number Failed |
Number Left |
Therapy | |
| 0.000 | 1.0000 | 0 | 0 | 0 | 35 | ||
| 1.000 | . | . | . | 1 | 34 | test | |
| 1.000 | 0.9429 | 0.0571 | 0.0392 | 2 | 33 | test | |
| 8.000 | 0.9143 | 0.0857 | 0.0473 | 3 | 32 | standard | |
| 10.000 | 0.8857 | 0.1143 | 0.0538 | 4 | 31 | standard | |
| 11.000 | 0.8571 | 0.1429 | 0.0591 | 5 | 30 | standard | |
| 15.000 | 0.8286 | 0.1714 | 0.0637 | 6 | 29 | test | |
| 25.000 | 0.8000 | 0.2000 | 0.0676 | 7 | 28 | test | |
| 25.000 | * | . | . | . | 7 | 27 | standard |
| 30.000 | 0.7704 | 0.2296 | 0.0713 | 8 | 26 | test | |
| 33.000 | 0.7407 | 0.2593 | 0.0745 | 9 | 25 | test | |
| 42.000 | 0.7111 | 0.2889 | 0.0772 | 10 | 24 | standard | |
| 44.000 | 0.6815 | 0.3185 | 0.0794 | 11 | 23 | test | |
| 72.000 | 0.6519 | 0.3481 | 0.0813 | 12 | 22 | standard | |
| 82.000 | 0.6222 | 0.3778 | 0.0828 | 13 | 21 | standard | |
| 87.000 | * | . | . | . | 13 | 20 | test |
| 100.000 | * | . | . | . | 13 | 19 | standard |
| 110.000 | 0.5895 | 0.4105 | 0.0847 | 14 | 18 | standard | |
| 111.000 | 0.5567 | 0.4433 | 0.0861 | 15 | 17 | test | |
| 112.000 | 0.5240 | 0.4760 | 0.0870 | 16 | 16 | test | |
| 118.000 | 0.4912 | 0.5088 | 0.0875 | 17 | 15 | standard | |
| 126.000 | 0.4585 | 0.5415 | 0.0876 | 18 | 14 | standard | |
| 144.000 | 0.4257 | 0.5743 | 0.0873 | 19 | 13 | standard | |
| 201.000 | 0.3930 | 0.6070 | 0.0865 | 20 | 12 | test | |
| 228.000 | 0.3602 | 0.6398 | 0.0852 | 21 | 11 | standard | |
| 231.000 | * | . | . | . | 21 | 10 | test |
| 242.000 | 0.3242 | 0.6758 | 0.0840 | 22 | 9 | test | |
| 283.000 | 0.2882 | 0.7118 | 0.0820 | 23 | 8 | test | |
| 314.000 | 0.2522 | 0.7478 | 0.0793 | 24 | 7 | standard | |
| 357.000 | 0.2161 | 0.7839 | 0.0757 | 25 | 6 | test | |
| 389.000 | 0.1801 | 0.8199 | 0.0711 | 26 | 5 | test | |
| 411.000 | 0.1441 | 0.8559 | 0.0654 | 27 | 4 | standard | |
| 467.000 | 0.1081 | 0.8919 | 0.0581 | 28 | 3 | test | |
| 587.000 | 0.0720 | 0.9280 | 0.0487 | 29 | 2 | test | |
| 991.000 | 0.0360 | 0.9640 | 0.0352 | 30 | 1 | test | |
| 999.000 | 0 | 1.0000 | . | 31 | 0 | test | |
| Note: | The marked survival times are censored observations. |
The distribution of event and censored observations among the four cell types is summarized in Output 49.1.5.
The graph of the estimated survivor functions is shown in Output 49.1.6. The adeno cell curve and the small cell curve are much closer to each other than they are to the large cell curve or the squamous cell curve. The survival rates of the adeno cell patients and the small cell patients decrease rapidly to approximately 29% in 90 days. Shapes of the large cell curve and the squamous cell curve are quite different, although both decrease less rapidly than those of the adeno and small cells. The squamous cell curve decreases more rapidly initially than the large cell curve, but the role is reversed in the later period.
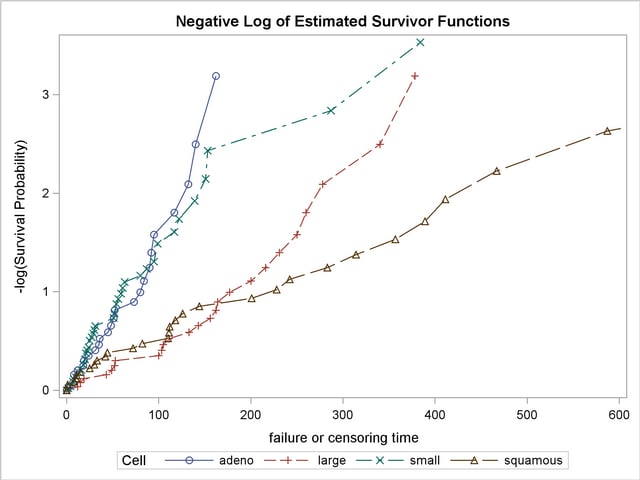
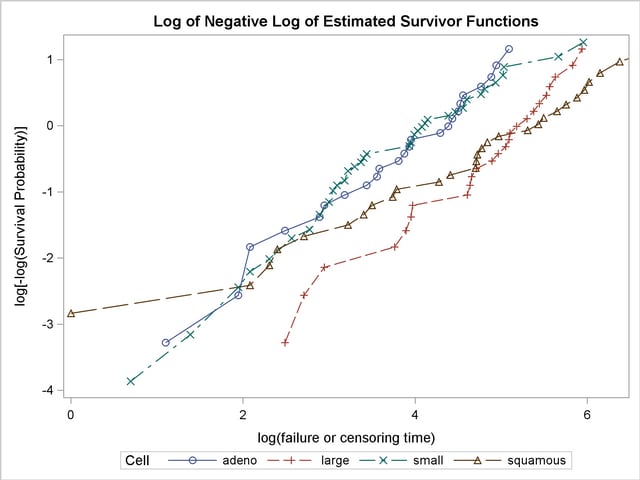
The graph of the negative log of the estimated survivor functions is displayed in Output 49.1.7. Output 49.1.8 displays the log of the negative log of the estimated survivor functions against the log of time.
Results of the homogeneity tests across cell types are given in Output 49.1.9. The log-rank and Wilcoxon statistics and their corresponding covariance matrices are displayed. Also given is a table that consists of the approximate chi-square statistics, degrees of freedom, and p-values for the log-rank, Wilcoxon, and likelihood ratio tests. All three tests indicate strong evidence of a significant difference among the survival curves for the four types of cancer cells (p<0.0001).
| Rank Statistics | ||
|---|---|---|
| Cell | Log-Rank | Wilcoxon |
| adeno | 10.306 | 697.0 |
| large | -8.549 | -1085.0 |
| small | 14.898 | 1278.0 |
| squamous | -16.655 | -890.0 |
| Covariance Matrix for the Log-Rank Statistics | ||||
|---|---|---|---|---|
| Cell | adeno | large | small | squamous |
| adeno | 12.9662 | -4.0701 | -4.4087 | -4.4873 |
| large | -4.0701 | 24.1990 | -7.8117 | -12.3172 |
| small | -4.4087 | -7.8117 | 21.7543 | -9.5339 |
| squamous | -4.4873 | -12.3172 | -9.5339 | 26.3384 |
Results of the log-rank test of the prognostic variables are shown in Output 49.1.10. The univariate test results correspond to testing each prognostic factor marginally. The joint covariance matrix of these univariate test statistics is also displayed. In computing the overall chi-square statistic, the partial chi-square statistics following a forward stepwise entry approach are tabulated.
Consider the log-rank test in Output 49.1.10. Since the univariate test for Kps has the largest chi-square (43.4747) among all the covariates, Kps is entered first. At this stage, the partial chi-square and the chi-square increment for Kps are the same as the univariate chi-square. Among all the covariates not in the model (Age, Prior, DiagTime, Treatment), Treatment has the largest approximate chi-square increment (1.7261) and is entered next. The approximate chi-square for the model containing Kps and Treatment is 43.4747+1.7261=45.2008 with 2 degrees of freedom. The third covariate entered is Age. The fourth is Prior, and the fifth is DiagTime. The overall chi-square statistic in the last line of the output is the partial chi-square for including all the covariates. It has a value of 46.4200 with 5 degrees of freedom, which is highly significant (p<0.0001).
| Univariate Chi-Squares for the Log-Rank Test | |||||
|---|---|---|---|---|---|
| Variable | Test Statistic |
Standard Error |
Chi-Square | Pr > Chi-Square |
Label |
| Age | -40.7383 | 105.7 | 0.1485 | 0.7000 | age in years |
| Prior | -19.9435 | 46.9836 | 0.1802 | 0.6712 | prior treatment? |
| DiagTime | -115.9 | 97.8708 | 1.4013 | 0.2365 | months till randomization |
| Kps | 1123.1 | 170.3 | 43.4747 | <.0001 | karnofsky index |
| Treatment | -4.2076 | 5.0407 | 0.6967 | 0.4039 | treatment indicator |
| Covariance Matrix for the Log-Rank Statistics | |||||
|---|---|---|---|---|---|
| Variable | Age | Prior | DiagTime | Kps | Treatment |
| Age | 11175.4 | -301.2 | -892.2 | -2948.4 | 119.3 |
| Prior | -301.2 | 2207.5 | 2010.9 | 78.6 | 13.9 |
| DiagTime | -892.2 | 2010.9 | 9578.7 | -2295.3 | 21.9 |
| Kps | -2948.4 | 78.6 | -2295.3 | 29015.6 | 61.9 |
| Treatment | 119.3 | 13.9 | 21.9 | 61.9 | 25.4 |
| Forward Stepwise Sequence of Chi-Squares for the Log-Rank Test | ||||||
|---|---|---|---|---|---|---|
| Variable | DF | Chi-Square | Pr > Chi-Square |
Chi-Square Increment |
Pr > Increment |
Label |
| Kps | 1 | 43.4747 | <.0001 | 43.4747 | <.0001 | karnofsky index |
| Treatment | 2 | 45.2008 | <.0001 | 1.7261 | 0.1889 | treatment indicator |
| Age | 3 | 46.3012 | <.0001 | 1.1004 | 0.2942 | age in years |
| Prior | 4 | 46.4134 | <.0001 | 0.1122 | 0.7377 | prior treatment? |
| DiagTime | 5 | 46.4200 | <.0001 | 0.00665 | 0.9350 | months till randomization |
You can establish this forward stepwise entry of prognostic factors by passing the matrix corresponding to the log-rank test to the RSQUARE method in the REG procedure, as follows. PROC REG finds the sets of variables that yield the largest chi-square statistics.
   data RSq;
      set Test;
      if _type_='LOG RANK';
      _type_='cov';
    proc print data=RSq;
    run;
    proc reg data=RSq(type=COV);
       model SurvTime=Age Prior DiagTime Kps Treatment
          / selection=rsquare;
       title 'All Possible Subsets of Covariates for the log-rank Test';
   run;
Output 49.1.11 displays the univariate statistics and their covariance matrix for the log-rank test.
| All Possible Subsets of Covariates for the log-rank Test |
| Obs | _TYPE_ | _NAME_ | SurvTime | Age | Prior | DiagTime | Kps | Treatment |
|---|---|---|---|---|---|---|---|---|
| 1 | cov | SurvTime | 46.42 | -40.74 | -19.94 | -115.86 | 1123.14 | -4.208 |
| 2 | cov | Age | -40.74 | 11175.44 | -301.23 | -892.24 | -2948.45 | 119.297 |
| 3 | cov | Prior | -19.94 | -301.23 | 2207.46 | 2010.85 | 78.64 | 13.875 |
| 4 | cov | DiagTime | -115.86 | -892.24 | 2010.85 | 9578.69 | -2295.32 | 21.859 |
| 5 | cov | Kps | 1123.14 | -2948.45 | 78.64 | -2295.32 | 29015.62 | 61.945 |
| 6 | cov | Treatment | -4.21 | 119.30 | 13.87 | 21.86 | 61.95 | 25.409 |
Results of the best subset regression are shown in Output 49.1.12. The variable Kps generates the largest univariate test statistic among all the covariates, the pair Kps and Age generate the largest test statistic among any other pairs of covariates, and so on. The entry order of covariates is identical to that of PROC LIFETEST.
| Number in Model |
R-Square | Variables in Model |
|---|---|---|
| 1 | 0.9366 | Kps |
| 1 | 0.0302 | DiagTime |
| 1 | 0.0150 | Treatment |
| 1 | 0.0039 | Prior |
| 1 | 0.0032 | Age |
| 2 | 0.9737 | Kps Treatment |
| 2 | 0.9472 | Age Kps |
| 2 | 0.9417 | Prior Kps |
| 2 | 0.9382 | DiagTime Kps |
| 2 | 0.0434 | DiagTime Treatment |
| 2 | 0.0353 | Age DiagTime |
| 2 | 0.0304 | Prior DiagTime |
| 2 | 0.0181 | Prior Treatment |
| 2 | 0.0159 | Age Treatment |
| 2 | 0.0075 | Age Prior |
| 3 | 0.9974 | Age Kps Treatment |
| 3 | 0.9774 | Prior Kps Treatment |
| 3 | 0.9747 | DiagTime Kps Treatment |
| 3 | 0.9515 | Age Prior Kps |
| 3 | 0.9481 | Age DiagTime Kps |
| 3 | 0.9418 | Prior DiagTime Kps |
| 3 | 0.0456 | Age DiagTime Treatment |
| 3 | 0.0438 | Prior DiagTime Treatment |
| 3 | 0.0355 | Age Prior DiagTime |
| 3 | 0.0192 | Age Prior Treatment |
| 4 | 0.9999 | Age Prior Kps Treatment |
| 4 | 0.9976 | Age DiagTime Kps Treatment |
| 4 | 0.9774 | Prior DiagTime Kps Treatment |
| 4 | 0.9515 | Age Prior DiagTime Kps |
| 4 | 0.0459 | Age Prior DiagTime Treatment |
| 5 | 1.0000 | Age Prior DiagTime Kps Treatment |
Copyright © 2009 by SAS Institute Inc., Cary, NC, USA. All rights reserved.