| The LIFETEST Procedure |
Rank Tests for the Association of Survival Time with Covariates
The rank tests for the association of covariates (Kalbfleisch and Prentice; 1980, Chapter 6) are more general cases of the rank tests for homogeneity. In this section, the index  is used to label all observations,
  , and the indices
  range only over the observations that correspond to events,
  . The ordered event times are denoted as
  , the corresponding vectors of covariates are denoted as
  , and the ordered times, both censored and event times, are denoted as
  .
.
The rank test statistics have the form
 |
where  is the total number of observations,
  are rank scores, which can be either log-rank or Wilcoxon rank scores,
  is 1 if the observation is an event and 0 if the observation is censored, and
  is the vector of covariates in the TEST statement for the th observation. Notice that the scores, , depend on the censoring pattern and that the terms are summed up over all observations.
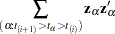
The log-rank scores are
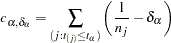 |
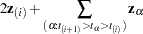
and the Wilcoxon scores are
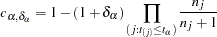 |
where  is the number at risk just prior to
  .
.
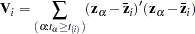
The estimates used for the covariance matrix of the log-rank statistics are
 |
where  is the corrected sum of squares and crossproducts matrix for the risk set at time ; that is,
 |
where
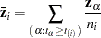 |
The estimate used for the covariance matrix of the Wilcoxon statistics is
 |
where
 |
 |
 |
|||
 |
|
 |
|||
 |
|
 |
|||
 |
|
 |
In the case of tied failure times, the statistics  are averaged over the possible orderings of the tied failure times. The covariance matrices are also averaged over the tied failure times. Averaging the covariance matrices over the tied orderings produces functions with appropriate symmetries for the tied observations; however, the actual variances of the statistics would be smaller than the preceding estimates. Unless the proportion of ties is large, it is unlikely that this will be a problem.
The univariate tests for each covariate are formed from each component of and the corresponding diagonal element of  as
as  . These statistics are treated as coming from a chi-square distribution for calculation of probability values.
The statistic  is computed by sweeping each pivot of the matrix in the order of greatest increase to the statistic. The corresponding sequence of partial statistics is tabulated. Sequential increments for including a given covariate and the corresponding probabilities are also included in the same table. These probabilities are calculated as the tail probabilities of a chi-square distribution with one degree of freedom. Because of the selection process, these probabilities should not be interpreted as p-values.
If desired for data screening purposes, the output data set requested by the OUTTEST= option can be treated as a sum of squares and crossproducts matrix and processed by the REG procedure by using the option METHOD=RSQUARE. Then the sets of variables of a given size can be found that give the largest test statistics. Output 49.1 illustrates this process.
Copyright © 2009 by SAS Institute Inc., Cary, NC, USA. All rights reserved.