| The FREQ Procedure |
Exact Statistics
Exact statistics can be useful in situations where the asymptotic assumptions are not met, and so the asymptotic p-values are not close approximations for the true p-values. Standard asymptotic methods involve the assumption that the test statistic follows a particular distribution when the sample size is sufficiently large. When the sample size is not large, asymptotic results might not be valid, with the asymptotic p-values differing perhaps substantially from the exact p-values. Asymptotic results might also be unreliable when the distribution of the data is sparse, skewed, or heavily tied. See Agresti (2007) and Bishop, Fienberg, and Holland (1975) for more information. Exact computations are based on the statistical theory of exact conditional inference for contingency tables, reviewed by Agresti (1992).
In addition to computation of exact p-values, PROC FREQ provides the option of estimating exact p-values by Monte Carlo simulation. This can be useful for problems that are so large that exact computations require a great amount of time and memory, but for which asymptotic approximations might not be sufficient.
Exact statistics are available for many PROC FREQ tests. For one-way tables, PROC FREQ provides exact p-values for the binomial proportion tests and the chi-square goodness-of-fit test. Exact confidence limits are available for the binomial proportion. For two-way tables, PROC FREQ provides exact p-values for the following tests: Pearson chi-square test, likelihood-ratio chi-square test, Mantel-Haenszel chi-square test, Fisher’s exact test, Jonckheere-Terpstra test, and Cochran-Armitage test for trend. PROC FREQ also computes exact p-values for tests of the following statistics: Pearson correlation coefficient, Spearman correlation coefficient, simple kappa coefficient, and weighted kappa coefficient. For  tables, PROC FREQ provides exact confidence limits for the odds ratio, exact unconditional confidence limits for the proportion difference, and McNemar’s exact test. For stratified tables, PROC FREQ provides Zelen’s exact test for equal odds ratios, exact confidence limits for the common odds ratio, and an exact test for the common odds ratio.
The following sections summarize the exact computational algorithms, define the exact p-values that PROC FREQ computes, discuss the computational resource requirements, and describe the Monte Carlo estimation option.
Computational Algorithms
PROC FREQ computes exact p-values for general  tables by using the network algorithm developed by Mehta and Patel (1983). This algorithm provides a substantial advantage over direct enumeration, which can be very time-consuming and feasible only for small problems. See Agresti (1992) for a review of algorithms for computation of exact p-values, and see Mehta, Patel, and Tsiatis (1984) and Mehta, Patel, and Senchaudhuri (1991) for information about the performance of the network algorithm.
The reference set for a given contingency table is the set of all contingency tables with the observed marginal row and column sums. Corresponding to this reference set, the network algorithm forms a directed acyclic network consisting of nodes in a number of stages. A path through the network corresponds to a distinct table in the reference set. The distances between nodes are defined so that the total distance of a path through the network is the corresponding value of the test statistic. At each node, the algorithm computes the shortest and longest path distances for all the paths that pass through that node. For statistics that can be expressed as a linear combination of cell frequencies multiplied by increasing row and column scores, PROC FREQ computes shortest and longest path distances by using the algorithm of Agresti, Mehta, and Patel (1990). For statistics of other forms, PROC FREQ computes an upper bound for the longest path and a lower bound for the shortest path by following the approach of Valz and Thompson (1994).
The longest and shortest path distances or bounds for a node are compared to the value of the test statistic to determine whether all paths through the node contribute to the p-value, none of the paths through the node contribute to the p-value, or neither of these situations occurs. If all paths through the node contribute, the p-value is incremented accordingly, and these paths are eliminated from further analysis. If no paths contribute, these paths are eliminated from the analysis. Otherwise, the algorithm continues, still processing this node and the associated paths. The algorithm finishes when all nodes have been accounted for.
In applying the network algorithm, PROC FREQ uses full numerical precision to represent all statistics, row and column scores, and other quantities involved in the computations. Although it is possible to use rounding to improve the speed and memory requirements of the algorithm, PROC FREQ does not do this because it can result in reduced accuracy of the p-values.
For one-way tables, PROC FREQ computes the exact chi-square goodness-of-fit test by the method of Radlow and Alf (1975). PROC FREQ generates all possible one-way tables with the observed total sample size and number of categories. For each possible table, PROC FREQ compares its chi-square value with the value for the observed table. If the table’s chi-square value is greater than or equal to the observed chi-square, PROC FREQ increments the exact p-value by the probability of that table, which is calculated under the null hypothesis by using the multinomial frequency distribution. By default, the null hypothesis states that all categories have equal proportions. If you specify null hypothesis proportions or frequencies by using the TESTP= or TESTF= option in the TABLES statement, then PROC FREQ calculates the exact chi-square test based on that null hypothesis.
Other exact computations are described in sections about the individual statistics. See the section Binomial Proportion for details about how PROC FREQ computes exact confidence limits and tests for the binomial proportion. See the section Odds Ratio and Relative Risks for 2 x 2 Tables for information about computation of exact confidence limits for the odds ratio for tables. Also, see the sections Exact Unconditional Confidence Limits for the Risk Difference, Exact Confidence Limits for the Common Odds Ratio, and Zelen’s Exact Test for Equal Odds Ratios.
Definition of p-Values
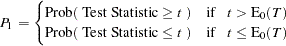
For several tests in PROC FREQ, the test statistic is nonnegative, and large values of the test statistic indicate a departure from the null hypothesis. Such nondirectional tests include the Pearson chi-square, the likelihood-ratio chi-square, the Mantel-Haenszel chi-square, Fisher’s exact test for tables larger than , McNemar’s test, and the one-way chi-square goodness-of-fit test. The exact p-value for a nondirectional test is the sum of probabilities for those tables having a test statistic greater than or equal to the value of the observed test statistic.
There are other tests where it might be appropriate to test against either a one-sided or a two-sided alternative hypothesis. For example, when you test the null hypothesis that the true parameter value equals 0 ( ), the alternative of interest might be one-sided (
 , or
, or  ) or two-sided (
 ). Such tests include the Pearson correlation coefficient, Spearman correlation coefficient, Jonckheere-Terpstra test, Cochran-Armitage test for trend, simple kappa coefficient, and weighted kappa coefficient. For these tests, PROC FREQ displays the right-sided p-value when the observed value of the test statistic is greater than its expected value. The right-sided p-value is the sum of probabilities for those tables for which the test statistic is greater than or equal to the observed test statistic. Otherwise, when the observed test statistic is less than or equal to the expected value, PROC FREQ displays the left-sided p-value. The left-sided p-value is the sum of probabilities for those tables for which the test statistic is less than or equal to the one observed. The one-sided p-value
  can be expressed as
 |
where  is the observed value of the test statistic and
  is the expected value of the test statistic under the null hypothesis. PROC FREQ computes the two-sided p-value as the sum of the one-sided p-value and the corresponding area in the opposite tail of the distribution of the statistic, equidistant from the expected value. The two-sided p-value
  can be expressed as
 |
If you specify the POINT option in the EXACT statement, PROC FREQ also displays exact point probabilities for the test statistics. The exact point probability is the exact probability that the test statistic equals the observed value.
Computational Resources
PROC FREQ uses relatively fast and efficient algorithms for exact computations. These recently developed algorithms, together with improvements in computer power, now make it feasible to perform exact computations for data sets where previously only asymptotic methods could be applied. Nevertheless, there are still large problems that might require a prohibitive amount of time and memory for exact computations, depending on the speed and memory available on your computer. For large problems, consider whether exact methods are really needed or whether asymptotic methods might give results quite close to the exact results, while requiring much less computer time and memory. When asymptotic methods might not be sufficient for such large problems, consider using Monte Carlo estimation of exact p-values, as described in the section Monte Carlo Estimation.
A formula does not exist that can predict in advance how much time and memory are needed to compute an exact p-value for a certain problem. The time and memory required depend on several factors, including which test is being performed, the total sample size, the number of rows and columns, and the specific arrangement of the observations into table cells. Generally, larger problems (in terms of total sample size, number of rows, and number of columns) tend to require more time and memory. Additionally, for a fixed total sample size, time and memory requirements tend to increase as the number of rows and columns increases, because this corresponds to an increase in the number of tables in the reference set. Also for a fixed sample size, time and memory requirements increase as the marginal row and column totals become more homogeneous. See Agresti, Mehta, and Patel (1990) and Gail and Mantel (1977) for more information.
At any time while PROC FREQ is computing exact p-values, you can terminate the computations by pressing the system interrupt key sequence (see the SAS Companion for your system) and choosing to stop computations. After you terminate exact computations, PROC FREQ completes all other remaining tasks. The procedure produces the requested output and reports missing values for any exact p-values that were not computed by the time of termination.
You can also use the MAXTIME= option in the EXACT statement to limit the amount of time PROC FREQ uses for exact computations. You specify a MAXTIME= value that is the maximum amount of clock time (in seconds) that PROC FREQ can use to compute an exact p-value. If PROC FREQ does not finish computing an exact p-value within that time, it terminates the computation and completes all other remaining tasks.
Monte Carlo Estimation
If you specify the option MC in the EXACT statement, PROC FREQ computes Monte Carlo estimates of the exact p-values instead of directly computing the exact p-values. Monte Carlo estimation can be useful for large problems that require a great amount of time and memory for exact computations but for which asymptotic approximations might not be sufficient. To describe the precision of each Monte Carlo estimate, PROC FREQ provides the asymptotic standard error and  % confidence limits. The confidence level
  is determined by the ALPHA= option in the EXACT statement, which, by default, equals 0.01 and produces 99% confidence limits. The N=n option in the EXACT statement specifies the number of samples that PROC FREQ uses for Monte Carlo estimation; the default is 10000 samples. You can specify a larger value for
  to improve the precision of the Monte Carlo estimates. Because larger values of generate more samples, the computation time increases. Alternatively, you can specify a smaller value of to reduce the computation time.
To compute a Monte Carlo estimate of an exact p-value, PROC FREQ generates a random sample of tables with the same total sample size, row totals, and column totals as the observed table. PROC FREQ uses the algorithm of Agresti, Wackerly, and Boyett (1979), which generates tables in proportion to their hypergeometric probabilities conditional on the marginal frequencies. For each sample table, PROC FREQ computes the value of the test statistic and compares it to the value for the observed table. When estimating a right-sided p-value, PROC FREQ counts all sample tables for which the test statistic is greater than or equal to the observed test statistic. Then the p-value estimate equals the number of these tables divided by the total number of tables sampled.
 |
 |
 |
|||
 |
|
 |
|||
 |
|
 |
|||
 |
|
 |
PROC FREQ computes left-sided and two-sided p-value estimates in a similar manner. For left-sided p-values, PROC FREQ evaluates whether the test statistic for each sampled table is less than or equal to the observed test statistic. For two-sided p-values, PROC FREQ examines the sample test statistics according to the expression for given in the section Definition of p-Values.
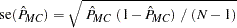
The variable  is a binomially distributed variable with
  trials and success probability
  . It follows that the asymptotic standard error of the Monte Carlo estimate is
 |
PROC FREQ constructs asymptotic confidence limits for the p-values according to
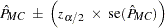 |
where  is the
  th percentile of the standard normal distribution and the confidence level is determined by the ALPHA= option in the EXACT statement.
When the Monte Carlo estimate  equals 0, PROC FREQ computes the confidence limits for the p-value as
 |
When the Monte Carlo estimate  equals 1, PROC FREQ computes the confidence limits as
 |
Copyright © 2009 by SAS Institute Inc., Cary, NC, USA. All rights reserved.