| The FREQ Procedure |
Risks and Risk Differences
The RISKDIFF option in the TABLES statement provides estimates of risks (or binomial proportions) and risk differences for  tables. This analysis might be appropriate when comparing the proportion of some characteristic for two groups, where row 1 and row 2 correspond to the two groups, and the columns correspond to two possible characteristics or outcomes. For example, the row variable might be a treatment or dose, and the column variable might be the response. See Collett (1991), Fleiss, Levin, and Paik (2003), and Stokes, Davis, and Koch (2000) for more information.
Let the frequencies of the table be represented as follows.
Column 1 |
Column 2 |
Total |
|
Row 1 |
|
|
|
Row 2 |
|
|
|
Total |
|
|
|


For column 1 and column 2, PROC FREQ provides estimates of the row 1 risk (or proportion), the row 2 risk, the overall risk and the risk difference. The risk difference is defined as the row 1 risk minus the row 2 risk. The risks are binomial proportions of their rows (row 1, row 2, or overall), and the computation of their standard errors and confidence limits follow the binomial proportion computations, which are described in the section Binomial Proportion.
The column 1 risk for row 1 is the proportion of row 1 observations classified in column 1,
 |
This estimates the conditional probability of the column 1 response, given the first level of the row variable.
The column 1 risk for row 2 is the proportion of row 2 observations classified in column 1,
 |
and the overall column 1 risk is the proportion of all observations classified in column 1,
 |
The column 1 risk difference compares the risks for the two rows, and it is computed as the column 1 risk for row 1 minus the column 1 risk for row 2,
 |
The risks and risk difference are defined similarly for column 2.
The standard error of the column 1 risk for row  is computed as
 |
The standard error of the overall column 1 risk is computed as
 |
If the two rows represent independent binomial samples, the standard error for the column 1 risk difference is computed as
 |
The standard errors are computed in a similar manner for the column 2 risks and risk difference.
Confidence Limits
By default, the RISKDIFF option provides standard Wald asymptotic confidence limits for the risks (row 1, row 2, and overall) and the risk difference. The risks are equivalent to binomial proportions of their corresponding rows, and the computations follow the methods in the section Wald Confidence Limits.
The standard Wald asymptotic confidence limits are based on the normal approximation to the binomial distribution. PROC FREQ computes the Wald confidence limits for the risks and risk differences as
 |
where  is the estimate,
  is the
  th percentile of the standard normal distribution, and
  is the standard error of the estimate. The confidence level
  is determined from the value of the ALPHA= option, which, by default, equals 0.05 and produces 95% confidence limits.
If you specify the CORRECT riskdiff-option or the RISKDIFFC option, PROC FREQ includes continuity corrections in the Wald asymptotic confidence limits for the risks and risk differences. The purpose of a continuity correction is to adjust for the difference between the normal approximation and the binomial distribution, which is discrete. See Fleiss, Levin, and Paik (2003) for more information. With the continuity correction, the asymptotic confidence limits are computed as
 |
where  is the continuity correction. For the row 1 risk,
  ; for the row 2 risk,
  ; for the overall risk,
  ; and for the risk difference,
 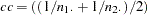 . The column 1 and column 2 risks use the same continuity corrections.
PROC FREQ also computes exact (Clopper-Pearson) confidence limits for the column 1, column 2, and overall risks. These confidence limits are constructed by inverting the equal-tailed test based on the binomial distribution. PROC FREQ uses the  distribution to compute the Clopper-Pearson confidence limits. See the section Exact (Clopper-Pearson) Confidence Limits for details.
PROC FREQ does not provide exact confidence limits for the risk difference by default. If you specify the RISKDIFF option in the EXACT statement, PROC FREQ provides exact unconditional confidence limits for the risk difference, which are described in the section Exact Unconditional Confidence Limits for the Risk Difference. Note that the conditional exact approach, which is the basis for other exact tests provided by PROC FREQ such as Fisher’s exact test, does not apply to the risk difference due to nuisance parameters. See Agresti (1992) for more information.
Tests
You can specify riskdiff-options to request tests of the risk (or proportion) difference. You can request tests of equality, noninferiority, superiority, and equivalence for the risk difference. The test of equality is a standard Wald asymptotic test, available with or without a continuity correction. For noninferiority, superiority, and equivalence tests of the risk difference, the following test methods are provided: Wald (with and without continuity correction), Hauck-Anderson, Farrington-Manning, and Newcombe score (with and without continuity correction). You can specify the test method with the METHOD= riskdiff-option. By default, PROC FREQ uses METHOD=WALD.
Equality Test
If you specify the EQUAL riskdiff-option, PROC FREQ computes a test of equality, or a test of the null hypothesis that the risk difference equals zero. For the column 1 (or 2) risk difference, this test can be expressed as  versus the alternative
  , where
  denotes the column 1 (or 2) risk difference. PROC FREQ computes a standard Wald asymptotic test, and the test statistic is
 |
By default, the standard error is computed from the sample proportions as
 |
If you specify the VAR=NULL riskdiff-option, the standard error is based on the null hypothesis that the row 1 and row 2 risks are equal,
 |
where  estimates the overall column 1 risk.
If you specify the CORRECT riskdiff-option or the RISKDIFFC option, PROC FREQ includes a continuity correction in the asymptotic test statistic. If  , the continuity correction is subtracted from
  in the numerator of the test statistic; otherwise, the continuity correction is added to the numerator. The value of the continuity correction is
 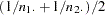 .
.
PROC FREQ computes one-sided and two-sided  -values for this test. When the test statistic
  is greater than 0, PROC FREQ displays the right-sided p-value, which is the probability of a larger value occurring under the null hypothesis. The one-sided p-value can be expressed as
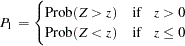 |
where  has a standard normal distribution. The two-sided p-value is computed as
  .
.
Noninferiority Test
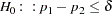
If you specify the NONINF riskdiff-option, PROC FREQ provides a noninferiority test for the risk difference, or the difference between two proportions. The null hypothesis for the noninferiority test is
 |
versus the alternative
 |
where  is the noninferiority margin. Rejection of the null hypothesis indicates that the row 1 risk is not inferior to the row 2 risk. See Chow, Shao, and Wang (2003) for more information.
You can specify the value of with the MARGIN= riskdiff-option. By default,  . You can specify the test method with the METHOD= riskdiff-option. The following methods are available for the risk difference noninferiority analysis: Wald (with and without continuity correction), Hauck-Anderson, Farrington-Manning, and Newcombe score (with and without continuity correction). The Wald, Hauck-Anderson, and Farrington-Manning methods provide tests and corresponding test-based confidence limits; the Newcombe score method provides only confidence limits. If you do not specify METHOD=, PROC FREQ uses the Wald test by default.
The confidence coefficient for the test-based confidence limits is  % (Schuirmann 1999). By default, if you do not specify the ALPHA= option, these are
  % confidence limits. You can compare the confidence limits to the noninferiority limit, –.
The following sections describe the noninferiority analysis methods for the risk difference.
Wald Test
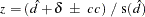
If you specify the METHOD=WALD riskdiff-option, PROC FREQ provides an asymptotic Wald test of noninferiority for the risk difference. This is also the default method. The Wald test statistic is computed as
 |
where ( ) estimates the risk difference and is the noninferiority margin.
By default, the standard error for the Wald test is computed from the sample proportions as
 |
If you specify the VAR=NULL riskdiff-option, the standard error is based on the null hypothesis that the risk difference equals – (Dunnett and Gent 1977). The standard error is computed as
 |
where
 |
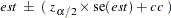
If you specify the CORRECT riskdiff-option or the RISKDIFFC option, a continuity correction is included in the test statistic. The continuity correction is subtracted from the numerator of the test statistic if the numerator is greater than zero; otherwise, the continuity correction is added to the numerator. The value of the continuity correction is .
The p-value for the Wald noninferiority test is 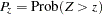 , where has a standard normal distribution.
Hauck-Anderson Test
If you specify the METHOD=HA riskdiff-option, PROC FREQ provides the Hauck-Anderson test for noninferiority. The Hauck-Anderson test statistic is computed as
 |
where and the standard error is computed from the sample proportions as
 |
The Hauck-Anderson continuity correction is computed as
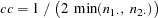 |
The p-value for the Hauck-Anderson noninferiority test is , where has a standard normal distribution. See Hauck and Anderson (1986) and Schuirmann (1999) for more information.
Farrington-Manning Test
If you specify the METHOD=FM riskdiff-option, PROC FREQ provides the Farrington-Manning test of noninferiority for the risk difference. The Farrington-Manning test statistic is computed as
|
where and
 |
where  and
and  are the maximum likelihood estimators of
  and
and  under the null hypothesis that the risk difference equals –. The p-value for the Farrington-Manning noninferiority test is then , where has a standard normal distribution.
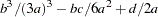
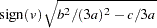
From Farrington and Manning (1990), the solution to the maximum likelihood equation is
 |
where
 |
 |
 |
|||
 |
|
 |
|||
 |
|
 |
|||
 |
|
 |
|||
 |
|
 |
|||
 |
|
 |
|||
 |
|
 |
|||
 |
|
 |
Newcombe Score Confidence Limits
If you specify the METHOD=SCORE riskdiff-option, PROC FREQ provides the Newcombe hybrid score (or Wilson) confidence limits for the risk difference. The confidence coefficient for the confidence limits is % (Schuirmann 1999). By default, if you do not specify the ALPHA= option, these are % confidence limits. You can compare the confidence limits to the noninferiority limit, –.
The Newcombe score confidence limits for the risk difference are constructed from the Wilson score confidence limits for each of the two individual proportions. The confidence limits for the individual proportions are used in the standard error terms of the Wald confidence limits for the proportion difference. See Newcombe (1998) and Barker et al. (2001) for more information.
Wilson score confidence limits for and are the roots of
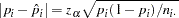 |
for  . The confidence limits are computed as
 |
See the section Wilson (Score) Confidence Limits for details.
Denote the lower and upper Wilson score confidence limits for as  and
and  , and denote the lower and upper confidence limits for as
  and
and  . The Newcombe score confidence limits for the proportion difference () are computed as
 |
|||
 |
If you specify the CORRECT riskdiff-option, PROC FREQ provides continuity-corrected Newcombe score confidence limits. By including a continuity correction of  , the Wilson score confidence limits for the individual proportions are the roots of
 |
These confidence limits for the individual proportions are then used in the standard error terms of the Wald confidence limits for the proportion difference to compute  and
and  .
.
Superiority Test
If you specify the SUP riskdiff-option, PROC FREQ provides a superiority test for the risk difference. The null hypothesis is
 |
versus the alternative
 |
where is the superiority margin. Rejection of the null hypothesis indicates that the row 1 proportion is superior to the row 2 proportion. You can specify the value of with the MARGIN= riskdiff-option. By default, .
The superiority analysis is identical to the noninferiority analysis but uses a positive value of the margin in the null hypothesis. The superiority computations follow those in the section Noninferiority Test by replacing – by . See Chow, Shao, and Wang (2003) for more information.
Equivalence Tests
If you specify the EQUIV riskdiff-option, PROC FREQ provides an equivalence test for the risk difference, or the difference between two proportions. The null hypothesis for the equivalence test is
 |
versus the alternative
 |
where  is the lower margin and
  is the upper margin. Rejection of the null hypothesis indicates that the two binomial proportions are equivalent. See Chow, Shao, and Wang (2003) for more information.
You can specify the value of the margins  and
and  with the MARGIN= riskdiff-option. If you do not specify MARGIN=, PROC FREQ uses lower and upper margins of –0.2 and 0.2 by default. If you specify a single margin value , PROC FREQ uses lower and upper margins of – and . You can specify the test method with the METHOD= riskdiff-option. The following methods are available for the risk difference equivalence analysis: Wald (with and without continuity correction), Hauck-Anderson, Farrington-Manning, and Newcombe’s score (with and without continuity correction). The Wald, Hauck-Anderson, and Farrington-Manning methods provide tests and corresponding test-based confidence limits; the Newcombe score method provides only confidence limits. If you do not specify METHOD=, PROC FREQ uses the Wald test by default.
PROC FREQ computes two one-sided tests (TOST) for equivalence analysis (Schuirmann 1987). The TOST approach includes a right-sided test for the lower margin and a left-sided test for the upper margin . The overall p-value is taken to be the larger of the two p-values from the lower and upper tests.
The section Noninferiority Test gives details about the Wald, Hauck-Anderson, Farrington-Manning and Newcombe score methods for the risk difference. The lower margin equivalence test statistic takes the same form as the noninferiority test statistic but uses the lower margin value in place of –. The upper margin equivalence test statistic take the same form as the noninferiority test statistic but uses the upper margin value in place of –.
The test-based confidence limits for the risk difference are computed according to the equivalence test method that you select. If you specify METHOD=WALD with VAR=NULL, or METHOD=FM, separate standard errors are computed for the lower and upper margin tests. In this case, the test-based confidence limits are computed by using the maximum of these two standard errors. The confidence limits have a confidence coefficient of % (Schuirmann 1999). By default, if you do not specify the ALPHA= option, these are % confidence limits. You can compare the confidence limits to the equivalence limits,  .
.
Exact Unconditional Confidence Limits for the Risk Difference
If you specify the RISKDIFF option in the EXACT statement, PROC FREQ provides exact unconditional confidence limits for the risk difference. Unconditional computations differ from the exact conditional approach that PROC FREQ uses for other exact statistics such as Fisher’s exact test. (See the section Exact Statistics for more information.) Exact conditional inference does not apply to the risk difference due to nuisance parameters. See Agresti (1992) for details. The unconditional approach eliminates nuisance parameters by maximizing the p-value over all possible values of the nuisance parameters (Santner and Snell 1980).
Denote the proportion difference by . For a table with row totals  and
and  , the joint probability function can be expressed in terms of the table cell frequencies and the parameters
  and ,
and ,
 |
When constructing confidence limits for the proportion difference, the parameter of interest is and is a nuisance parameter.
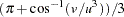
Denote the observed value of the proportion difference by  . The
. The  % confidence limits for are computed as
 |
|
 |
|||
 |
|
 |
where
 |
|
 |
|||
 |
|
 |
The set  includes all tables with row sums equal to and , and
  denotes the value of the proportion difference (
 ) for table
  in
in  . To compute
  , the sum includes probabilities of those tables for which (
 ), where
  is the observed value of the proportion difference. For a fixed value of
  , is taken to be the maximum sum over all possible values of . See Santner and Snell (1980) and Agresti and Min (2001) for details.
This method of eliminating the nuisance parameter is considered to be a conservative approach (Agresti and Min 2001). Additionally, the confidence limits are conservative for small samples because this is a discrete problem; the confidence coefficient is not exactly ( ) but is at least (). See Agresti (1992) for more information.
Copyright © 2009 by SAS Institute Inc., Cary, NC, USA. All rights reserved.