| The FREQ Procedure |
Jonckheere-Terpstra Test
The JT option in the TABLES statement provides the Jonckheere-Terpstra test, which is a nonparametric test for ordered differences among classes. It tests the null hypothesis that the distribution of the response variable does not differ among classes. It is designed to detect alternatives of ordered class differences, which can be expressed as  (or
(or  ), with at least one of the inequalities being strict, where
  denotes the effect of class
  . For such ordered alternatives, the Jonckheere-Terpstra test can be preferable to tests of more general class difference alternatives, such as the Kruskal–Wallis test (produced by the WILCOXON option in the NPAR1WAY procedure). See Pirie (1983) and Hollander and Wolfe (1999) for more information about the Jonckheere-Terpstra test.
The Jonckheere-Terpstra test is appropriate for a two-way table in which an ordinal column variable represents the response. The row variable, which can be nominal or ordinal, represents the classification variable. The levels of the row variable should be ordered according to the ordering you want the test to detect. The order of variable levels is determined by the ORDER= option in the PROC FREQ statement. The default is ORDER=INTERNAL, which orders by unformatted values. If you specify ORDER=DATA, PROC FREQ orders values according to their order in the input data set. For more information about how to order variable levels, see the ORDER= option.
The Jonckheere-Terpstra test statistic is computed by first forming  Mann-Whitney counts
  , where
  , for pairs of rows in the contingency table,
 |
 |
 |
|||
 |
 |
 |
where  is response
  in row
  . The Jonckheere-Terpstra test statistic is computed as
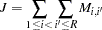 |
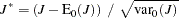
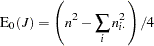
This test rejects the null hypothesis of no difference among classes for large values of  . Asymptotic p-values for the Jonckheere-Terpstra test are obtained by using the normal approximation for the distribution of the standardized test statistic. The standardized test statistic is computed as
 |
where  and
and  are the expected value and variance of the test statistic under the null hypothesis,
 |
 |
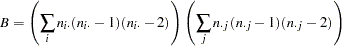
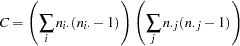
where
 |
 |
 |
PROC FREQ computes one-sided and two-sided p-values for the Jonckheere-Terpstra test. When the standardized test statistic is greater than its null hypothesis expected value of zero, PROC FREQ displays the right-sided p-value, which is the probability of a larger value of the statistic occurring under the null hypothesis. A small right-sided p-value supports the alternative hypothesis of increasing order from row 1 to row  . When the standardized test statistic is less than or equal to zero, PROC FREQ displays the left-sided p-value. A small left-sided p-value supports the alternative of decreasing order from row 1 to row .
The one-sided p-value for the Jonckheere-Terpstra test,  , is computed as
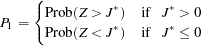 |
where  has a standard normal distribution. The two-sided p-value,
  , is computed as
 |
PROC FREQ also provides exact p-values for the Jonckheere-Terpstra test. You can request the exact test by specifying the JT option in the EXACT statement. See the section Exact Statistics for more information.
Copyright © 2009 by SAS Institute Inc., Cary, NC, USA. All rights reserved.