| The FREQ Procedure |
Cochran-Armitage Test for Trend
The TREND option in the TABLES statement provides the Cochran-Armitage test for trend, which tests for trend in binomial proportions across levels of a single factor or covariate. This test is appropriate for a two-way table where one variable has two levels and the other variable is ordinal. The two-level variable represents the response, and the other variable represents an explanatory variable with ordered levels. When the two-way has two columns and  rows, PROC FREQ tests for trend across the levels of the row variable, and the binomial proportion is computed as the proportion of observations in the first column. When the table has two rows and
  columns, PROC FREQ tests for trend across the levels of the column variable, and the binomial proportion is computed as the proportion of observations in the first row.
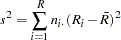
The trend test is based on the regression coefficient for the weighted linear regression of the binomial proportions on the scores of the explanatory variable levels. See Margolin (1988) and Agresti (2002) for details. If the table has two columns and rows, the trend test statistic is computed as
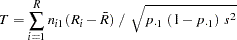 |
where  is the score of row
  ,
,  is the average row score, and
 |
The SCORES= option in the TABLES statement determines the type of row scores used in computing the trend test (and other score-based statistics). The default is SCORES=TABLE. See the section Scores for details. For character variables, the table scores for the row variable are the row numbers (for example, 1 for the first row, 2 for the second row, and so on). For numeric variables, the table score for each row is the numeric value of the row level. When you perform the trend test, the explanatory variable might be numeric (for example, dose of a test substance), and the variable values might be appropriate scores. If the explanatory variable has ordinal levels that are not numeric, you can assign meaningful scores to the variable levels. Sometimes equidistant scores, such as the table scores for a character variable, might be appropriate. For more information on choosing scores for the trend test, see Margolin (1988).
The null hypothesis for the Cochran-Armitage test is no trend, which means that the binomial proportion  is the same for all levels of the explanatory variable. Under the null hypothesis, the trend statistic has an asymptotic standard normal distribution.
PROC FREQ computes one-sided and two-sided p-values for the trend test. When the test statistic is greater than its null hypothesis expected value of zero, PROC FREQ displays the right-sided p-value, which is the probability of a larger value of the statistic occurring under the null hypothesis. A small right-sided p-value supports the alternative hypothesis of increasing trend in proportions from row 1 to row . When the test statistic is less than or equal to zero, PROC FREQ displays the left-sided p-value. A small left-sided p-value supports the alternative of decreasing trend.
The one-sided p-value for the trend test is computed as
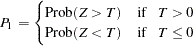 |
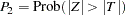
where  has a standard normal distribution. The two-sided p-value is computed as
 |
PROC FREQ also provides exact p-values for the Cochran-Armitage trend test. You can request the exact test by specifying the TREND option in the EXACT statement. See the section Exact Statistics for more information.
Copyright © 2009 by SAS Institute Inc., Cary, NC, USA. All rights reserved.