| Scatter Plots |
Scatter Plots
A scatter plot is a graphic representation of the relationship between two variables.
You can identify and label observations in the scatter plot, control the orientation of the plot, and control the information shown on the axes. You can explore multivariate data in a scatter plot matrix.
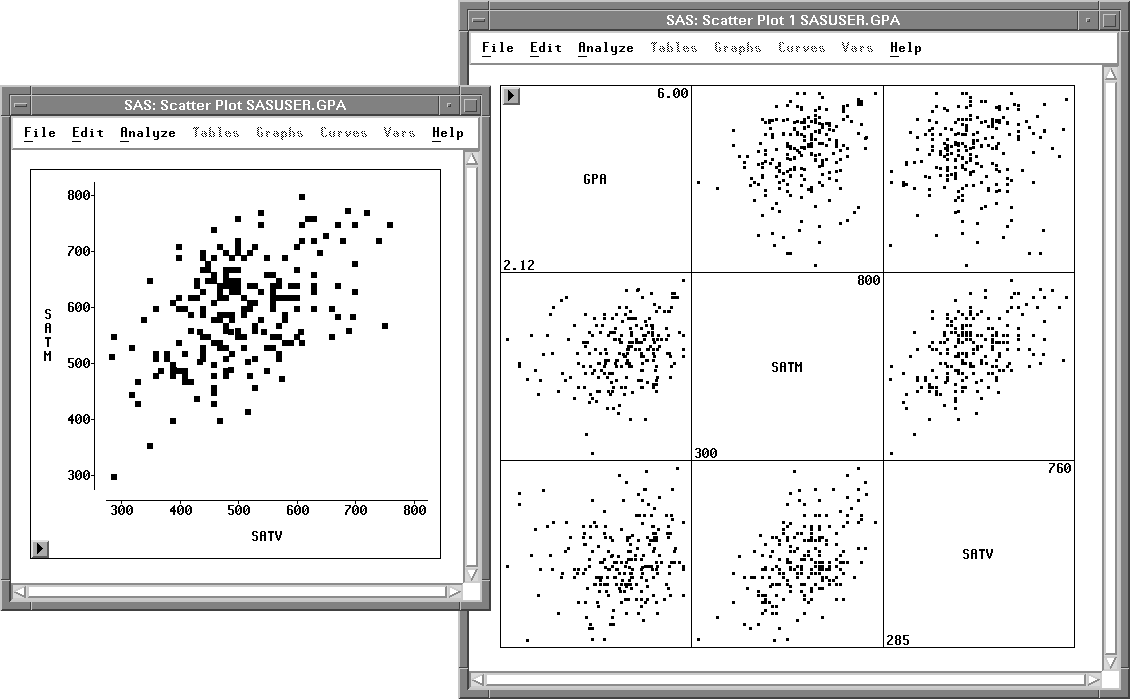
Figure 35.1: Scatter Plot and Scatter Plot Matrix