| Scatter Plots |
Variables
To create a scatter plot, choose Analyze:Scatter Plot ( Y X ). If you have already selected two or more variables, you obtain a scatter plot matrix. A scatter plot matrix consists of all pairwise scatter plots of the selected variables. If you assign Y and X roles to the same set of variables, variable names and minimum and maximum values appear in the diagonal panels.
If you have not selected any variables, a variables dialog appears.
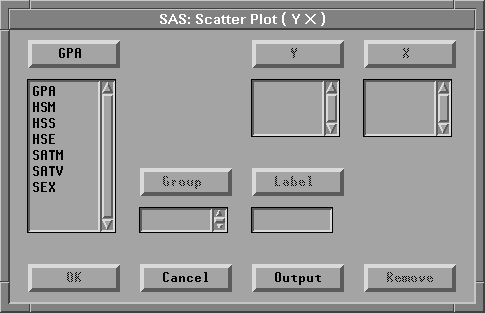
Figure 35.2: Scatter Plot Variables Dialog
In the dialog, select at least one Y variable and at least one X variable.
You can select one or more Group variables if you have grouped data. This creates scatter plots for each group.
You can select a Label variable to label observations in the plots.
Copyright © 2007 by SAS Institute Inc., Cary, NC, USA. All rights reserved.