| Multiple Regression |
Modifying the Model
It may be possible to simplify the model without losing explanatory power. The change in the adjusted R-square value is one indicator of whether you are losing explanatory power by removing a variable. The estimate for HSS has the largest p-value, 0.3619. Remove HSS from the model and see what effect this has on the adjusted R-square value.
From the fit variables dialog, follow these steps to request a new model with HSS removed. Remember, if you click Apply in the variables dialog, the dialog stays on the display so you can easily modify the regression model. You may need to rearrange the windows on your display if the fit variables dialog is not visible.
| Select HSS in the X variables list, then click the Remove button. |
This removes HSS from the model.
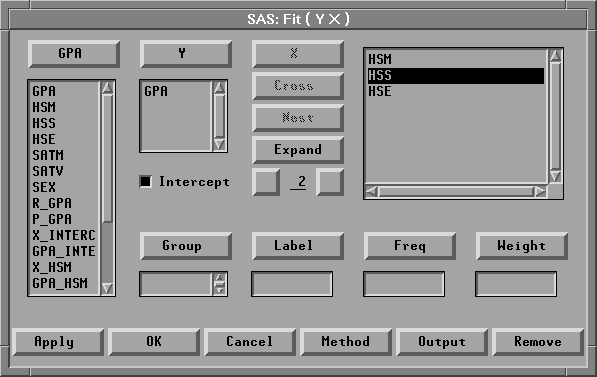
Figure 14.17: Removing the Variable HSS
| Click the Apply button. |
A new fit window appears, as shown in Figure 14.18.
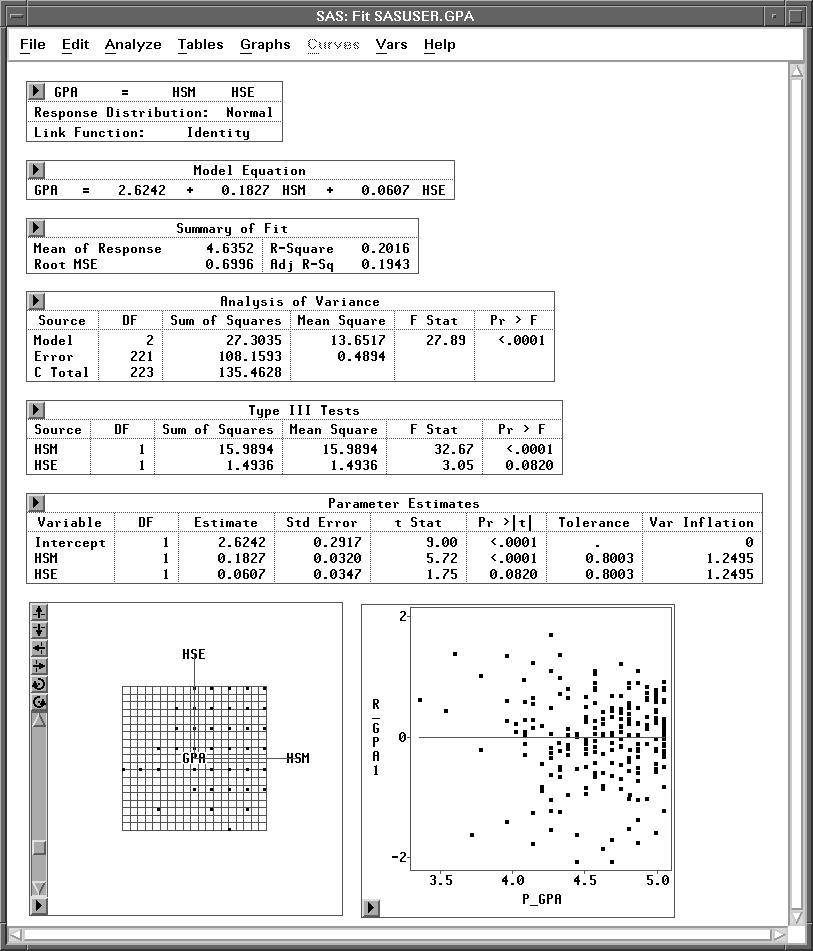
Figure 14.18: Fit Window with HSM and HSE as Explanatory Variables
Reposition the two fit windows so you can compare the two models. Notice that the adjusted R-square value has actually increased slightly from 0.1937 to 0.1943. Little explanatory power is lost by removing HSS. Notice that within this model the p-value for HSE is a modest 0.0820. You can remove HSE from the new fit window without creating a third fit window.
| Select HSE in the second fit window. |
| Choose Edit:Delete in the second fit window. |
This recomputes the second fit using only HSM as an explanatory variable.
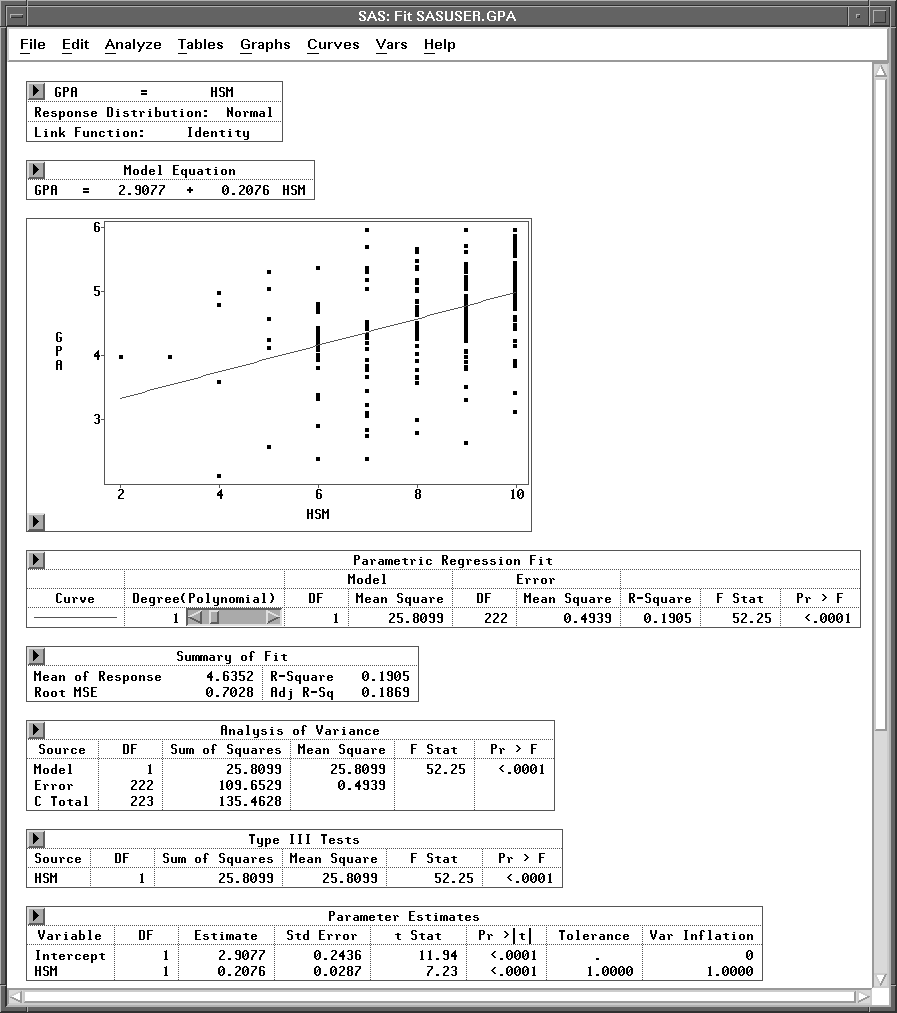
Figure 14.19: Fit Window with HSM as Explanatory Variable
The adjusted R-square value drops only slightly to 0.1869. Removing HSE from the model also appears to have little effect. So, of the three explanatory variables you considered, only HSM appears to have strong explanatory power.
Copyright © 2007 by SAS Institute Inc., Cary, NC, USA. All rights reserved.