| Multivariate Analyses |
Principal Component Analysis
You can generate tables of output from principal component analyses by setting options in the principal component options dialog shown in Figure 40.6 or from the Tables menu shown in Figure 40.11. Select Principal Components from the Tables menu to display the principal component tables dialog shown in Figure 40.16.
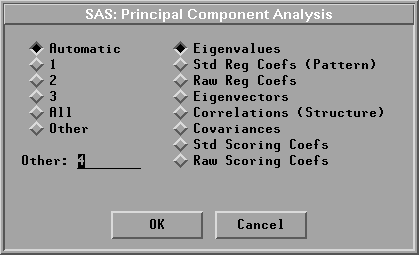
Figure 40.16: Principal Component Tables Dialog
Choose Automatic to display principal components with eigenvalues greater than the average eigenvalue. Selecting 1, 2, or 3 gives you 1, 2, or 3 principal components. All gives you all eigenvalues. Selecting 0 in the principal component options dialog suppresses the principal component tables.
The Eigenvalues (COV) or Eigenvalues (CORR) table includes the eigenvalues of the covariance or correlation matrix, the difference between successive eigenvalues, the proportion of variance explained by each eigenvalue, and the cumulative proportion of variance explained.
Eigenvalues correspond to each of the principal components and represent a partitioning of the total variation in the sample. The sum of all eigenvalues is equal to the sum of all variable variances if the covariance matrix is used or to the number of variables, p, if the correlation matrix is used.
The Eigenvectors (COV) or Eigenvectors (CORR) table includes the eigenvectors of the covariance or correlation matrix. Eigenvectors correspond to each of the principal components and are used as the coefficients to form linear combinations of the Y variables (principal components).
Figure 40.17 shows tables of all eigenvalues and eigenvectors for the first two principal components.
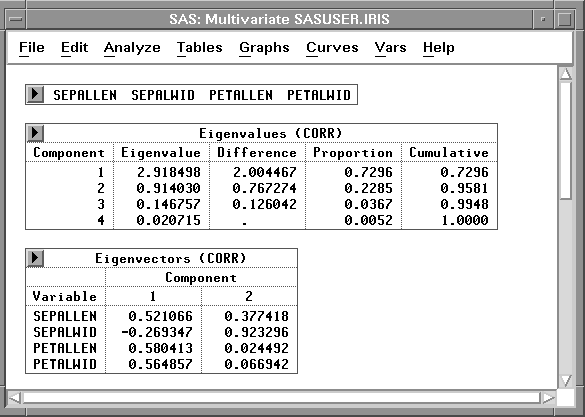
Figure 40.17: Eigenvalues and Eigenvectors Tables
The Correlations (Structure) and Covariances tables include the correlations and covariances, respectively, between the Y variables and principal components. The correlation and covariance matrices measure the strength of the linear relationship between the derived principal components and each of the Y variables. Figure 40.18 shows the correlations and covariances between the Y variables and the first two principal components.
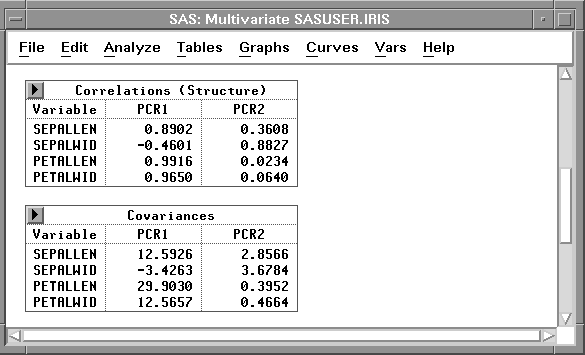
Figure 40.18: Correlations and Covariances Tables
The scoring coefficients are the coefficients of the Y variables used to generate principal components. The Std Scoring Coefs table includes the scoring coefficients of the standardized Y variables, and the Raw Scoring Coefs table includes the scoring coefficients of the centered Y variables.
The regression coefficients are the coefficients of principal components used to generate estimated Y variables. The Std Reg Coefs (Pattern) and Raw Reg Coefs tables include the regression coefficients of principal components used to generate estimated standardized and centered Y variables. Figure 40.19 shows the regression coefficients of the principal components for the standardized Y variables, as well as the scoring coefficients of the standardized Y variables for the first two principal components.
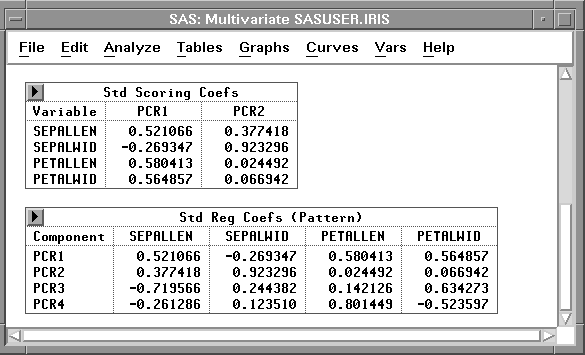
Figure 40.19: Regression Coefficients and Scoring Coefficients Tables
Copyright © 2007 by SAS Institute Inc., Cary, NC, USA. All rights reserved.