| Multivariate Analyses |
Variables
To create a multivariate analysis, choose Analyze:Multivariate ( Y's ). If you have already selected one or more interval variables, these selected variables are treated as Y variables and a multivariate analysis for the variables appears. If you have not selected any variables, a variables dialog appears.
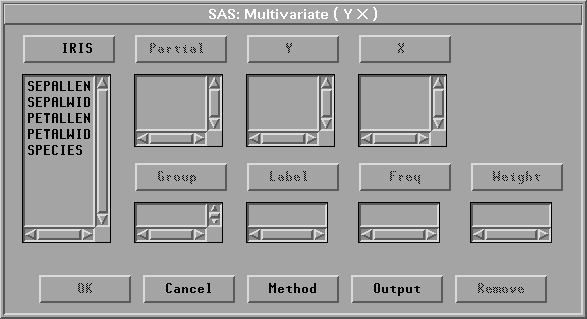
Figure 40.2: Multivariate Variables Dialog
Select at least one Y variable. With canonical correlation analysis and maximum redundancy analysis, you need to select a set of X variables. With canonical discriminant analysis, you need to select a nominal Y variable and a set of X variables.
Without X variables, sums of squares and crossproducts, corrected sums of squares and crossproducts, covariances, and correlations are displayed as symmetric matrices with Y variables as both the row variables and the column variables. With a nominal Y variable, these statistics are displayed as symmetric matrices with X variables as both the row variables and the column variables. When both interval Y variables and interval X variables are selected, these statistics are displayed as rectangular matrices with Y variables as the row variables and X variables as the column variables.
You can select one or more Partial variables. The multivariate analysis analyzes Y and X variables using their residuals after partialling out the Partial variables.
You can select one or more Group variables, if you have grouped data. This creates one multivariate analysis for each group. You can select a Label variable to label observations in the plots.
You can select a Freq variable. If you select a Freq variable, each observation is assumed to represent ni observations, where ni is the value of the Freq variable.
You can select a Weight variable to specify relative weights for each observation in the analysis. The details of weighted analyses are explained in the "Method" section, which follows, and the "Weighted Analyses" section at the end of this chapter.
Copyright © 2007 by SAS Institute Inc., Cary, NC, USA. All rights reserved.