| Logistic Regression |
Modifying the Model
Plots of the residuals against other variables may suggest extensions of the model. Alternatively you may be able to remove some variables and thus simplify the model without losing explanatory power. The Type III (Wald) Tests table or the possibly more accurate Type III (LR) Tests table contains statistics that can help you decide whether to remove an effect. If the p-value associated with the test is large, then there is little evidence for any explanatory value of the corresponding variable.
| Choose Tables:Type III (LR) Tests. |
![[menu]](images/log_logeq6.gif)
Figure 16.6: Tables Menu
This displays the table shown in Figure 16.7.
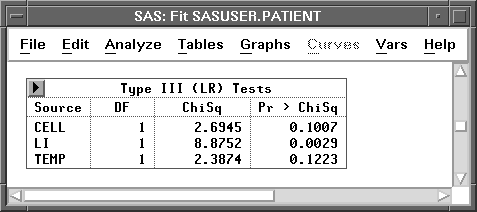
Figure 16.7: Likelihood Ratio Type III Tests
The p-values for TEMP and CELL are relatively large, suggesting these effects could be removed. Although the numbers are different, the same conclusions would be reached from the corresponding Wald tests. In the Fit Variables dialog, follow these steps to request a new model with TEMP removed.
| Select TEMP in the effects list, then click the Remove button. |
TEMP disappears from the effects list.
| Click on Apply, and a new fit window appears, as shown in Figure 16.8. |
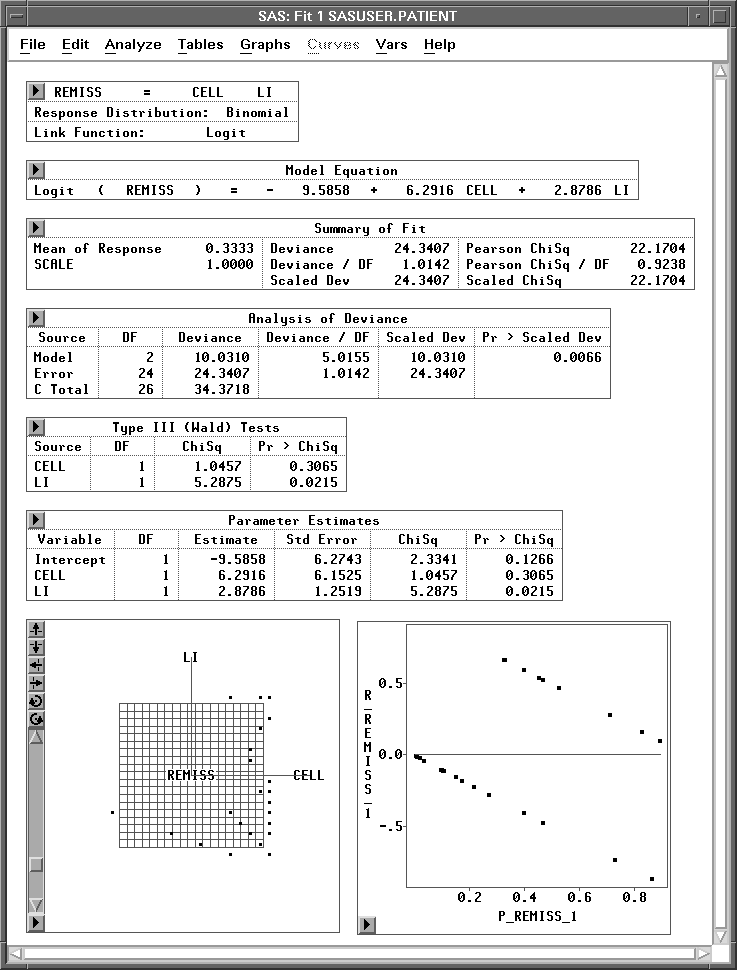
Figure 16.8: Fit Window with CELL and LI as Explanatory Variables
| Choose Tables:Type III (LR) Tests in the new fit window. |
This displays a Type III (LR) Tests table in the window.
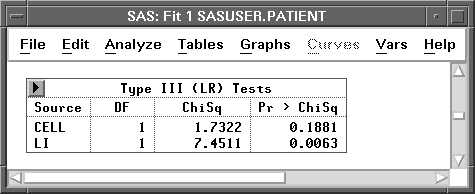
Figure 16.9: Likelihood Ratio Type III Tests
The p-value for CELL in the LR test suggests that this effect could also be removed.
| Click on the variable CELL in the effects list in the Fit Dialog. |
Then click on Remove. CELL disappears from the effects list.
| Click on Apply, and a new Fit window appears, as shown in Figure 16.10. |
Since the new model contains only one X variable, the fit window displays a plot of REMISS versus CELL.
Using the Apply button, you have quickly created three logistic regression models. Logistic regression is only one special case of the generalized linear model. Another case, Poisson regression, is described in the next chapter.
Related Reading |
Generalized Linear Models, Chapter 39. |
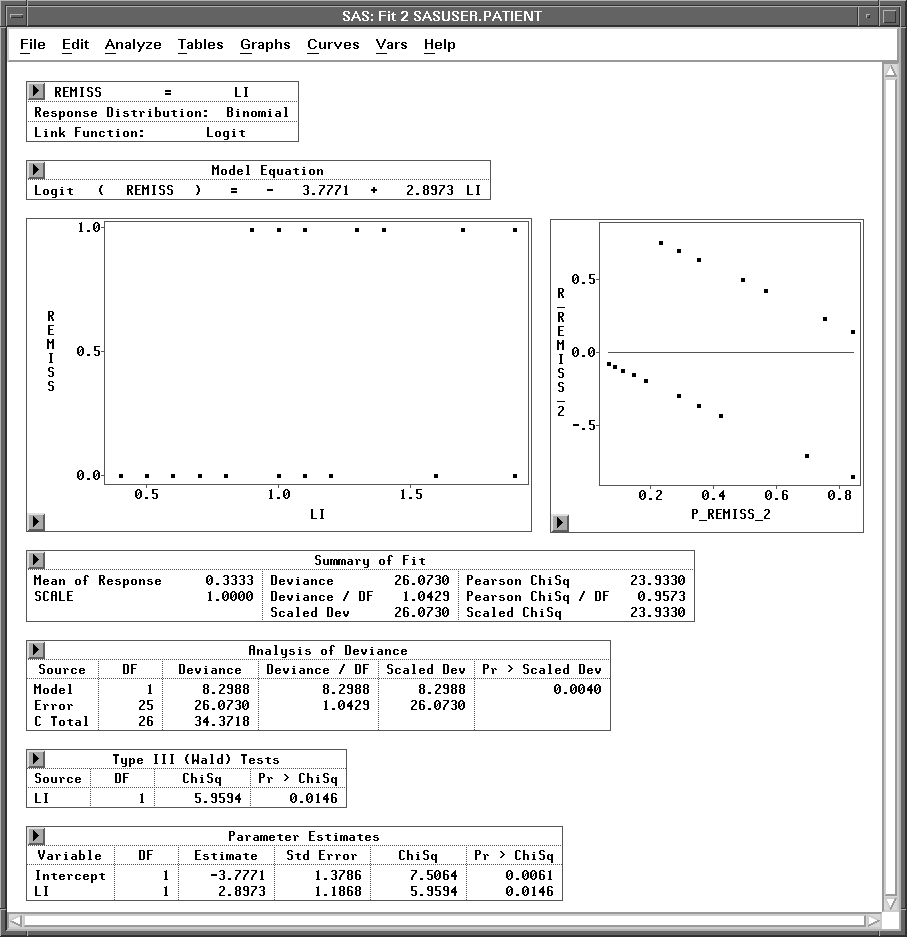
Figure 16.10: Fit Window with LI as the Only Explanatory Variable
Copyright © 2007 by SAS Institute Inc., Cary, NC, USA. All rights reserved.