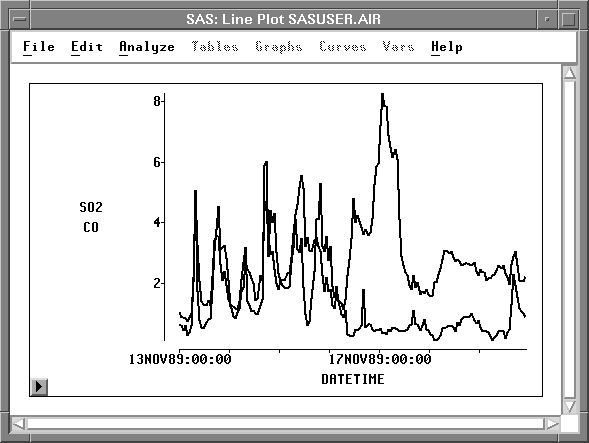
You can create line plots to show the path of a variable over time. You can control the orientation of the plot, the information shown on the axes, and the color of the lines.
Figure 34.1: Line Plot