| Line Plots |
Variables
To assign variables for a line plot, choose Analyze:Line Plot ( Y X ). If you have already selected two or more variables, you obtain a line plot. The last variable you selected is assigned the X role, and all other variables are assigned the Y role.
If you have not selected any variables, a variables dialog appears.
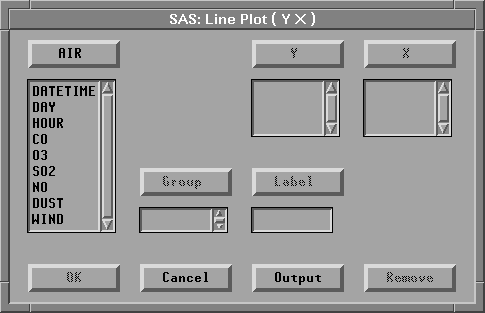
Figure 34.2: Line Plot Variables Dialog
In the dialog, select at least one Y variable and at least one X variable. You will obtain one line plot for each X variable, while multiple Y variables are represented on each plot as multiple lines.
You can select one or more Group variables if you have grouped data. This creates line plots for each group.
You can select a Label variable to label observations in the plots.
Copyright © 2007 by SAS Institute Inc., Cary, NC, USA. All rights reserved.