| Hiding Observations |
Toggling the Display of Observations
You can show subsets of your data by toggling the display of observations. This causes observations to be displayed only when they are selected.
| Deselect all observations by clicking in any open area of a graph. |
| Choose Edit:Windows:Renew to redisplay the scatter plot variables dialog. |
![[menu]](images/hid_hideq2.gif)
| Click on GPA in the variables list and then click on the X button. |
This adds GPA to the X variables list.
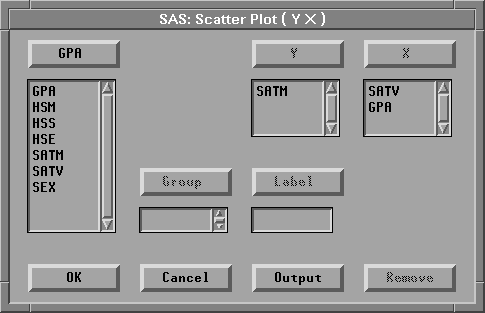
Figure 9.8: Variable Roles Assigned
| Click the OK button. |
This creates two scatter plots, as shown in Figure 9.9.
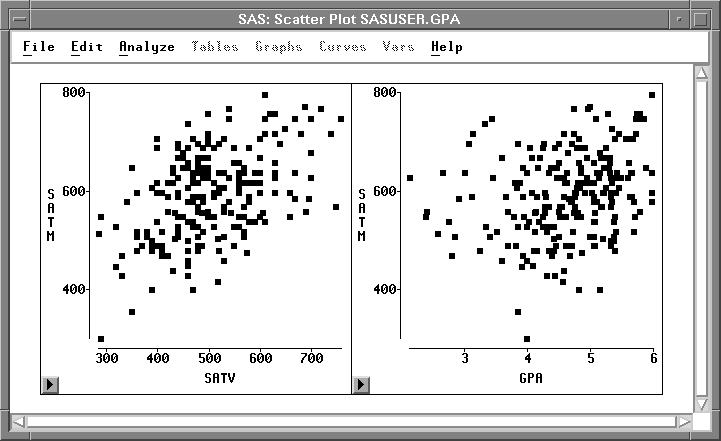
Figure 9.9: Scatter Plots
| Click on the button at the lower left to display the scatter plot pop-up menu. |
Choose Observations to turn off the display of observations in the scatter plot.
![[menu]](images/hid_hideq3.gif)
Figure 9.10: Scatter Plot Pop-up Menu
Do the same thing for the scatter plot on the right side. All the observation markers disappear, as shown in Figure 9.11.
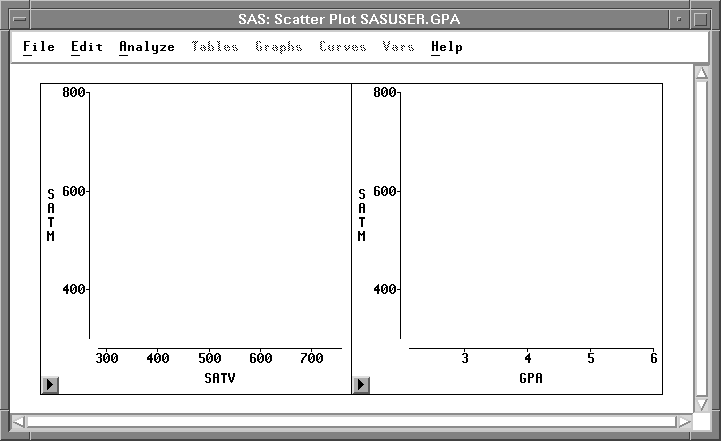
Figure 9.11: Turning Off Observations Display
| Choose Edit:Observations:Find |
This displays the Find Observations dialog. Select the variable SEX. With the default values in the other lists, this creates a test for SEX = Female.
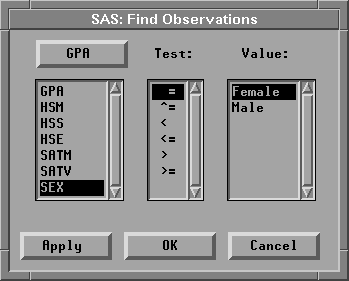
Figure 9.12: Find Observations Dialog
| Click the OK button. |
This selects all Female observations and displays them in the scatter plots.
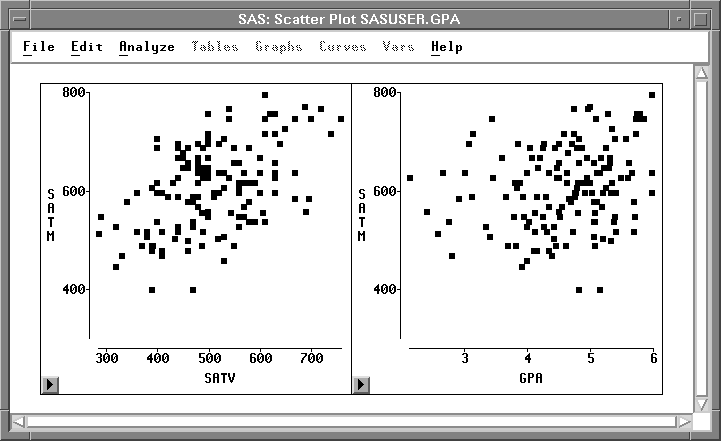
Figure 9.13: Female Observations
| Choose Edit:Observations:Invert Selection. |
Invert Selection deselects all selected observations and selects all deselected observations. Now the scatter plots show all observations where SEX is Male.
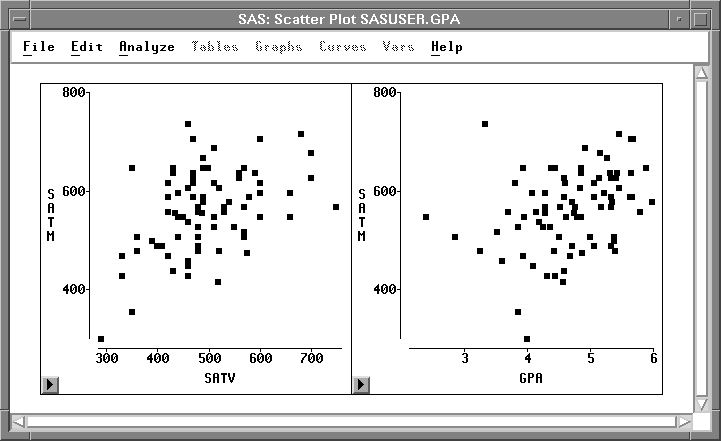
Figure 9.14: Male Observations
Toggling observations in the scatter plots shows there are more females than males in these data. The female students appear to have slightly higher scores on the mathematics portion of the SAT exam.
Copyright © 2007 by SAS Institute Inc., Cary, NC, USA. All rights reserved.