| Hiding Observations |
Hiding Individual Observations
You can adjust the range of data displayed and show subsets of your data by hiding observations.
Note |
Hiding observations in graphs does not exclude them from calculations. To exclude observations from calculations, see Chapter 21, "Comparing Analyses." |
| Open the GPA data set. |
| Create a scatter plot of SATM versus SATV. |
Use the techniques described in Chapter 5, "Exploring Data in Two Dimensions."
| Select the two observations with values of SATM below 400. |
Use extended selection or drag a rectangle around both observations.
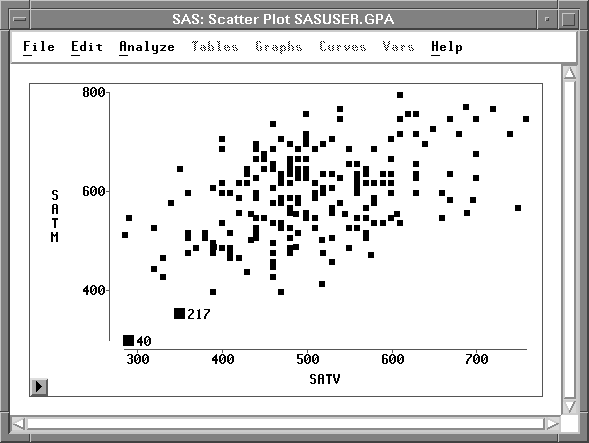
Figure 9.2: Observations Selected
| Choose Edit:Observations:Hide in Graphs. |
![[menu]](images/hid_hideq1.gif)
Figure 9.3: Edit: Observations Menu
This causes the selected observations to disappear from the graph. The graph rescales automatically. The new SATM axis starts at 400.
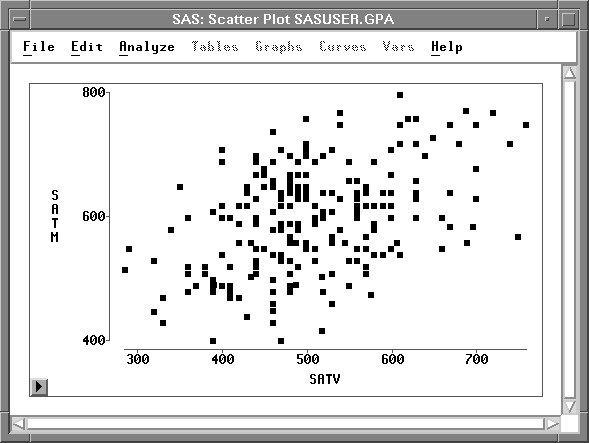
Figure 9.4: Observations Hidden
| Choose Find Next from the data window pop-up menu. |
This scrolls to the next selected observation and shows that the hidden observation has no marker. The absence of the marker in the data window indicates that the observation is hidden in all graphs.
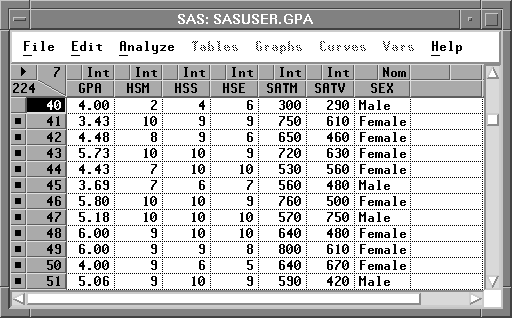
Figure 9.5: Data Window after Hiding Observations
| Choose Edit:Observations:Show in Graphs. |
Figure 9.6: Edit: Observations Menu
This makes the observations visible again. The scatter plot rescales.
Copyright © 2007 by SAS Institute Inc., Cary, NC, USA. All rights reserved.