| Fit Analyses |
Parametric Profile Surface Plot
With more than two explanatory interval variables in the model, a parametric profile surface plot is a continuous surface plot of the predicted responses from the fitted parametric model on a set of regular grids of a pair of explanatory variables. The values of the remaining explanatory variables are initially set at their means and can be adjusted with the sliders.
By default, the first two explanatory variables are used in the surface plot. You can also create profile surface plots for other explanatory variables by selecting the two variables before choosing Graphs:Surface Plot:Parametric profile. Figure 39.32 shows a parametric profile surface plot of oxy as a quadratic function of runpulse and maxpulse with rstpulse = 53.4516.
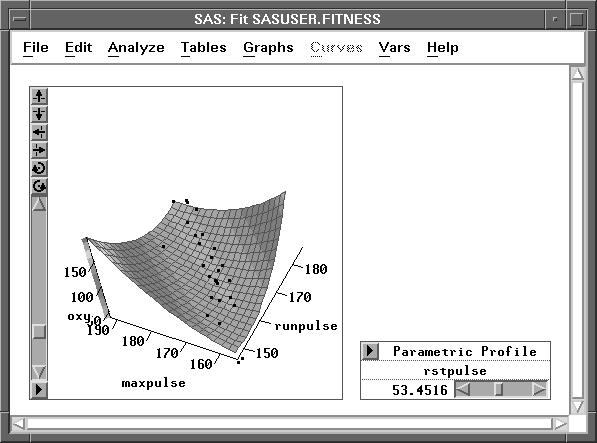
Figure 39.32: Parametric Profile Surface Plot
Copyright © 2007 by SAS Institute Inc., Cary, NC, USA. All rights reserved.