| Fit Analyses |
Parametric Surface Plot
With two explanatory interval variables in the model, a parametric surface plot is a continuous surface plot of the predicted responses from the fitted parametric model on a set of regular grids of the explanatory variables. Figure 39.27 shows a response surface plot of oxy as a quadratic function of age and weight.
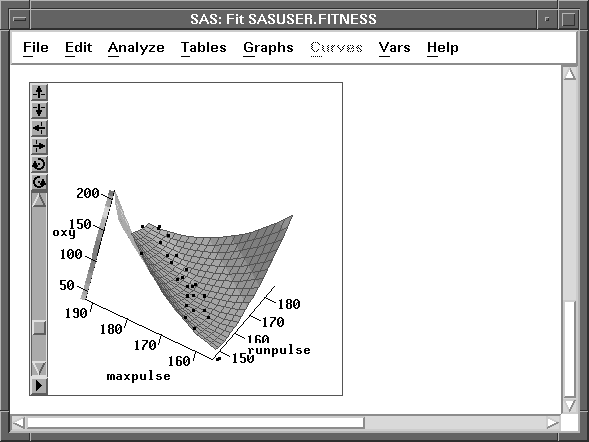
Figure 39.27: Parametric Surface Plot
The response surface is displayed with options Drawing Modes:Smooth Color and Axes:Three Sections.
Copyright © 2007 by SAS Institute Inc., Cary, NC, USA. All rights reserved.