| Distribution Analyses |
Output
To view or change the options associated with your distribution analysis, click on the Output button from the variables dialog. This displays the output options dialog.
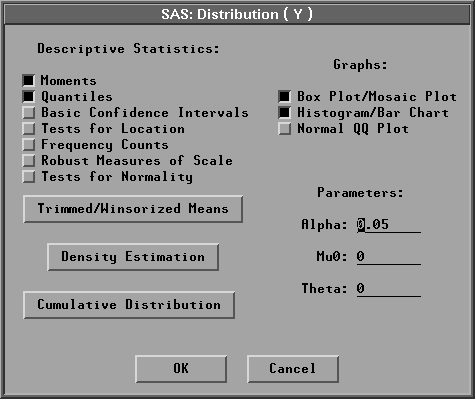
Figure 38.4: Distribution Output Options Dialog
The options you set in this dialog determine which tables and graphs appear in the distribution window. A distribution analysis can include descriptive statistics, graphs, density estimates, and cumulative distribution function estimates. By default, SAS/INSIGHT software displays a moments table, a quantiles tables, a box plot, and a histogram. Individual tables and graphs are described following this section.
You can specify the ![]() coefficient in the Parameters:Alpha: entry field. The
coefficient in the Parameters:Alpha: entry field. The ![]() confidence level is used in the basic confidence intervals and the trimmed/Winsorized means tables. You can specify
confidence level is used in the basic confidence intervals and the trimmed/Winsorized means tables. You can specify ![]() in the Parameters: Mu0: entry field.
in the Parameters: Mu0: entry field. ![]() is used in the tests for location and the trimmed/Winsorized means tables. You can also specify
is used in the tests for location and the trimmed/Winsorized means tables. You can also specify ![]() in the Parameters: Theta: entry field. The parameter
in the Parameters: Theta: entry field. The parameter ![]() is used in the parametric density estimation and cumulative distribution for lognormal, exponential, and Weibull distributions.
is used in the parametric density estimation and cumulative distribution for lognormal, exponential, and Weibull distributions.
If you select a Weight variable, tables of weighted moments, weighted quantiles, weighted confidence intervals, weighted tests for location, and weighted frequency counts can be generated. Robust measures of scale, tests for normality, and trimmed/Winsorized means are not computed. Graphs of weighted box plot, weighted histogram, and weighted normal QQ plot can also be generated.
The Trimmed/Winsorized Means button enables you to view or change the options associated with trimmed and Winsorized means. Click on Trimmed/Winsorized Means to display the Trimmed/Winsorized Means dialog.
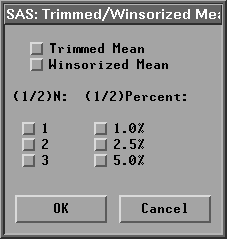
Figure 38.5: Trimmed / Winsorized Means Dialog
In the dialog, you choose the number of observations trimmed or Winsorized in each tail in (1/2)N and the percent of observations trimmed or Winsorized in each tail in (1/2)Percent. If you specify a percentage, the smallest integer greater than or equal to np is trimmed or Winsorized.
The Density Estimation button enables you to set the options associated with both parametric density and nonparametric kernel density estimation. Click on Density Estimation to display the Density Estimation dialog.
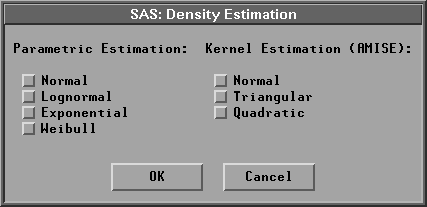
Figure 38.6: Density Estimation Dialog
If you select Parametric Estimation:Normal, a normal distribution with the sample mean and standard deviation is created. For the lognormal, exponential, and Weibull distributions, you specify the threshold parameter ![]() in the Parameters:Theta: entry field in the distribution output options dialog, as shown in Figure 38.4, and have the remaining parameters estimated by the maximum-likelihood estimates.
in the Parameters:Theta: entry field in the distribution output options dialog, as shown in Figure 38.4, and have the remaining parameters estimated by the maximum-likelihood estimates.
If you select a Weight variable, the weighted parametric normal density and weighted kernel density are generated. The parametric lognormal, exponential, and Weibull density are not computed.
The Cumulative Distribution button enables you to set the options associated with cumulative distribution estimation. Click on Cumulative Distribution to display the Cumulative Distribution dialog.
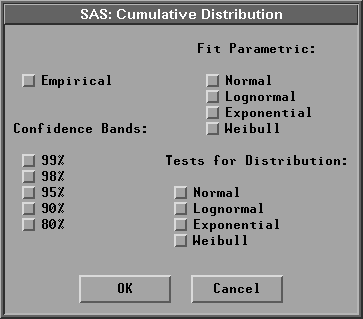
Figure 38.7: Cumulative Distribution Dialog
If you select Fit Parametric:Normal, a normal distribution with the sample mean and standard deviation is created. For the lognormal, exponential, and Weibull distributions, you specify the threshold parameter ![]() in the Parameters:Theta: entry field in the distribution output options dialog, as shown in Figure 38.4, and have the remaining parameters estimated by the maximum-likelihood estimates.
in the Parameters:Theta: entry field in the distribution output options dialog, as shown in Figure 38.4, and have the remaining parameters estimated by the maximum-likelihood estimates.
If you select a Weight variable, weighted empirical and normal cumulative distribution functions can be generated. The confidence bands, the parametric lognormal, exponential, and Weibull cumulative distributions, and tests for distribution are not computed.
Click on OK to close the dialogs and create your distribution analysis.
Copyright © 2007 by SAS Institute Inc., Cary, NC, USA. All rights reserved.