| Distribution Analyses |
Method
Observations with missing values for a Y variable are not used in the analysis for that variable. Observations with Weight or Freq values that are missing or that are less than or equal to zero are not used. Only the integer part of Freq values is used.
The following notation is used in the rest of this chapter:
- n is the number of nonmissing values.
- yi is the ith observed nonmissing value.
- y(i)is the ith ordered nonmissing value,
 .
.  is the sample mean,
  .
.- d is the variance divisor.
- s2 is the sample variance,
 .
.
- zi is the standardized value,
 .
.
The summation ![]() represents a summation of
represents a summation of ![]() .
.
Based on the variance definition, vardef, the variance divisor d is computed as
| for vardef=DF, degrees of freedom | ||
| for vardef=N, number of observations |
The skewness is a measure of the tendency of the deviations from the mean to be larger in one direction than in the other. The sample skewness is calculated as
| for vardef=DF | ||
| for vardef=N |
where c3n = [n/((n-2))][1/((n-1))].
The kurtosis is primarily a measure of the heaviness of the tails of a distribution. The sample kurtosis is calculated as
| for vardef=DF | ||
| for vardef=N |
where c4n = [(n(n+1))/((n-2)(n-3))][1/((n-1))] and cn = [((n-1)2)/((n-2)(n-3))].
When the observations are independently distributed with a common mean and unequal variances, ![]() ,where wi are individual weights, weighted analyses may be appropriate. You select a Weight variable to specify relative weights for each observation in the analysis.
,where wi are individual weights, weighted analyses may be appropriate. You select a Weight variable to specify relative weights for each observation in the analysis.
The following notation is used in weighted analyses:
- wi is the weight associated with yi.
- w(i) is the weight associated with y(i).
 is the average observation weight,
  .
. is the weighted sample mean,
  .
.- s2w is the weighted sample variance,
 .
. - zwi is the standardized value,
 .
.
In addition to vardef=DF and vardef=N, the variance divisor is also computed as
| for vardef=WDF, sum of weights minus 1 | ||
| for vardef=WGT, sum of weights |
With ![]() ,
, ![]() and the expected value
and the expected value

Note |
The use of vardef=WDF/WGT may not be appropriate since it is the weighted average of individual variances, |
For vardef=DF/N, s2w is the variance of observations with unit weight and may not be informative in the weighted plots of parametric normal distributions. SAS/INSIGHT software uses the weighted sample variance for an observation with average weight, ![]() , to replace s2w in the plots.
, to replace s2w in the plots.
The weighted skewness is computed as
| for DF | ||
| for N |
The weighted kurtosis is computed as
| for DF | ||
| for N |
The formulations are invariant under the transformation w*i = c wi, c > 0. The sample skewness and kurtosis are set to missing if vardef=WDF or vardef=WGT.
To view or change the divisor d used in the calculation of variances, or to view or change the use of observations with missing values, click on the Method button from the variables dialog to display the method options dialog.
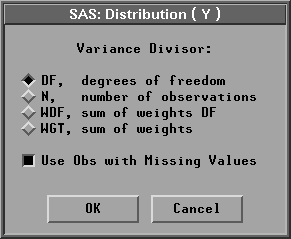
Figure 38.3: Distribution Method Options Dialog
By default, SAS/INSIGHT software uses vardef=DF, degrees of freedom to compute the variance divisor.
When multiple Y variables are analyzed, and some Y variables have missing values, the Use Obs with Missing Values option uses all observations with nonmissing values for the Y variable being analyzed. If the option is turned off, observations with missing values for any Y variable are not used for any analysis.
Copyright © 2007 by SAS Institute Inc., Cary, NC, USA. All rights reserved.