| Configuring SAS/INSIGHT Software |
Setting Display, Window, and Graph Options
Display options, window options, and graph options modify aspects of the software that affect every analysis. To set display options, choose Edit:Windows:Display Options. Note that you also set window options and graph options from the Edit:Windows menu.
![[menu]](images/cfg_coneq3.gif)
Figure 29.9: Edit:Windows Menu
This displays the display options dialog, as shown in Figure 29.10.
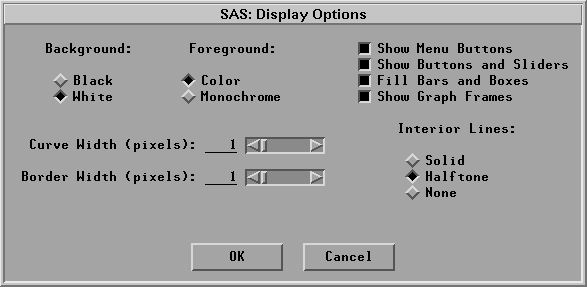
Figure 29.10: Display Options Dialog
The dialog contains the following options:
| Background | specifies either Black or White background. |
| Foreground | specifies either Color or Monochrome foreground. Monochrome display improves printed output by removing shades of gray used to approximate color. |
| Show Menu Buttons | governs the display of pop-up menu buttons in all windows. Turn this option off to remove menu buttons. |
| Show Buttons and Sliders | governs the display of all buttons and sliders except menu buttons. Turn this option off to remove buttons and sliders. |
| Fill Bars and Boxes | specifies the use of pattern fill in bar charts, box plots, and mosaic plots. Turn this option off to display empty bars and boxes. On slower hosts, turning this option off improves display speed as well as printed output. |
| Show Graph Frames | In nonrotating plots, this option specifies whether the two axes are displayed as two disjoint line segments or are joined together as part of a frame. |
| Curve Width | sets the default width of curves in pixels. On most hosts, a width of 1 pixel maximizes display speed. |
| Border Width | sets the default width of graph and table borders in pixels. When you are printing with a black background, increasing border width improves the display of graphs and tables. |
| Interior Lines | sets the display of lines within the data window and analysis tables. Solid produces solid lines; Halftone produces a dimmer line; None removes interior lines. Solid and None settings improve display speed on personal computers. |
The figures in this book are produced with Foreground set to Monochrome and Curve Width set to 2 pixels. Most figures have Show Graph Frames turned off.
To set window options, choose Edit:Windows:Window Options. This displays the window options dialog.
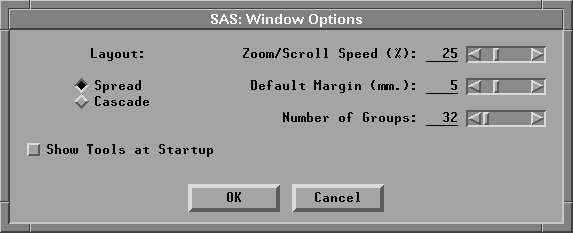
Figure 29.11: Window Options
The dialog contains the following options:
- Layout
- sets the algorithm for positioning windows. Spread spreads the windows so that the maximum number of tables and graphs are visible. Cascade causes each window to be offset a small distance from the previous window. On some hosts, the effect of this option is overridden by the host window manager.
- Show Tools at Startup
- causes the Tools window to display automatically when you invoke SAS/INSIGHT software.
- Zoom/Scroll Speed (%)
- sets the speed of the zoom tool and the speed of automatic scrolling when you drag a selection past the window border. The speed is a percentage value between 0 and 100. Some hosts override this option.
- Default Margin (mm.)
- sets the spacing in millimeters between graphs and tables in analysis windows. If your display is small, reduce this value to maximize the display of information.
- Number of Groups
- sets the number of groups you can use in an analysis without getting a request for confirmation.
Zoom/Scroll Speed, Default Margin, and Number of Groups can be controlled by sliders to the right of the option. To set these options, either click or drag on the sliders or type in the entry field.
To set graph options, choose Edit:Windows:Graph Options. This displays the graph options dialog.

Figure 29.12: Graph Options
The dialog contains the following options:
- Default Marker
- sets the default marker shape. On personal computers, Square and Plus are the best choices; these markers are the fastest to display. On fast workstations, Circle is preferable to minimize interference between plotted observations.
- Excluded Marker
- sets the marker shape for observations that are excluded from calculations. X is the default. If you choose None, marker shape is not affected by exclusion.
- Fast Draw
- sets display algorithms for rotation, brushing, manipulation of histograms, and dynamic curve fitting. By default, this option is off, which produces slower but smoother dynamic effects. If this option is on, speed is improved but, on some hosts, the display may flicker. The better choice of algorithms depends on your host, the size of your graphs, and the number of observations.
- Marker Size (%)
- sets the default size of markers in plots. This is the marker size used when you choose Marker Sizes:Size to Fit. This is a percentage value between 0 and 100.
- Graph Size (%)
- sets the default size of windows and graphs. This is a percentage value between 0 and 100. If your display is small, reduce this value to display more graphs.
To see the effects of various display, window, and graph options, follow these steps.
| Create a fit analysis for the model NO_RBI = NO_HITS. |
Use the techniques described in Chapter 13, "Fitting Curves." This creates the fit analysis shown in Figure 29.13.
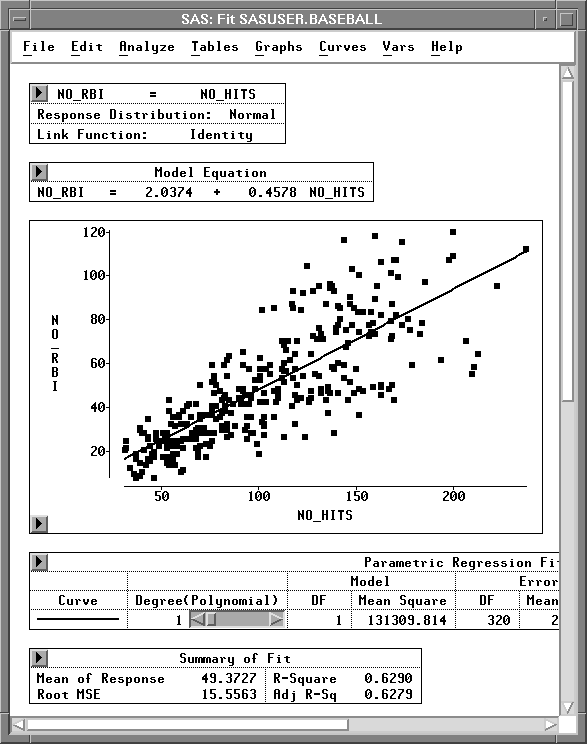
Figure 29.13: Fit Analysis
| Choose Edit:Windows:Display Options to display the display options dialog |
| Click on the toggle button for Show Menu Buttons. |
Recall that the figures here already have Foreground set to Monochrome and Curve Width set to 2 pixels.
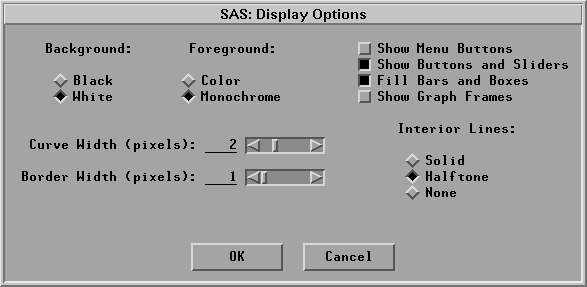
Figure 29.14: Setting Display Options
| Click OK to set the display options and close the dialog |
| Choose Edit:Windows:Window Options to display the window options dialog |
| Set the Default Margin to 1 mm. |

Figure 29.15: Setting Window Options
| Click OK to set the window options and close the dialog |
| Choose Edit:Windows:Graph Options to display the graph options dialog |
| Set the Marker Size to 100%. |
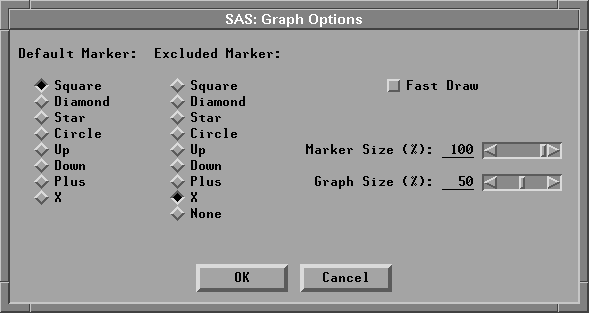
Figure 29.16: Setting Graph Options
| Click OK to set the graph options and close the dialog |
| Choose Edit:Windows:Renew in the fit analysis window. |
This displays the fit analysis variables dialog.
| Click OK in the variables dialog |
This redisplays the fit analysis with the modified option settings. Contrast Figure 29.17 with Figure 39. Note that the menu buttons are no longer displayed, the space between the tables and graphs is reduced, and the marker size is increased.
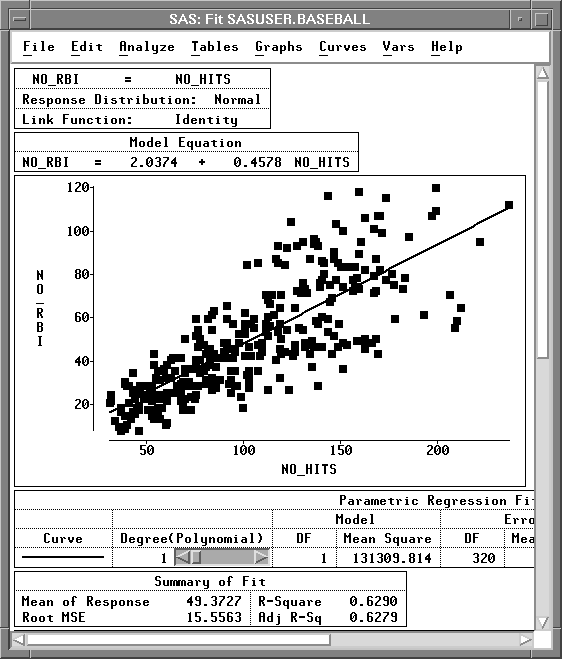
Figure 29.17: Modified Fit Analysis
Copyright © 2007 by SAS Institute Inc., Cary, NC, USA. All rights reserved.