| Configuring SAS/INSIGHT Software |
Setting Method and Output Options
Method options and output options affect only the individual analysis window for which they are set. You can set method options to determine how SAS/INSIGHT software performs calculations for a particular analysis. You can set output options to control the output produced in a graph or analysis. To modify method and output options for a box plot, follow these steps.
| Open the BASEBALL data set. |
| Choose Analyze:Box Plot/Mosaic Plot ( Y ). |
![[menu]](images/cfg_coneq1.gif)
This displays the box plot variables dialog, as shown in Figure 29.3. Note that both a Method and an Output button are displayed in this dialog. You can set Output options for each of the choices in the Analyze menu in Figure 29.2. You can set Method options for each of these choices except for line plots, scatter plots, and rotating plots. You can find details on options for each analysis in the reference chapters.
| Assign NO_RBI the Y role by clicking on NO_RBI, then on Y. |
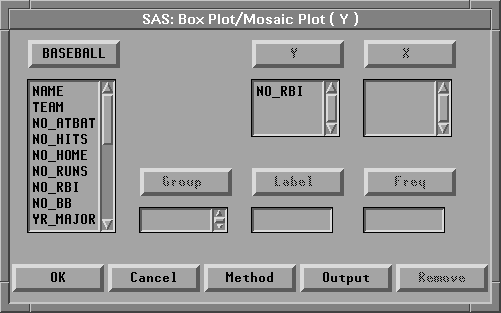
Figure 29.3: Box Plot Variables Dialog
| Click the OK button to create the box plot. |
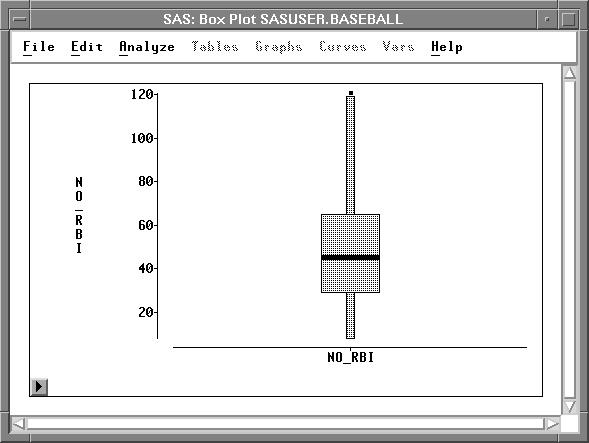
Figure 29.4: Box Plot
| Choose Edit:Windows:Renew in the box plot window. |
This redisplays the box plot variables dialog.
![[menu]](images/cfg_coneq2.gif)
Figure 29.5: Edit:Windows Menu
| Click on the Method button to display the box plot method dialog |
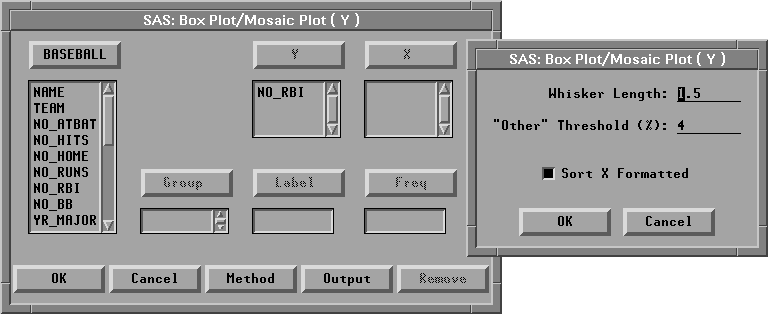
Figure 29.6: Variables and Method Dialogs
| Change the whisker length to 1.0 and click the OK button in the method dialog |
| Click the Output button to display the box plot output dialog |
| Click the Means, Labels, and Y Axis Vertical buttons. |
The Means and Y Axis Vertical buttons are toggles. The display of a means diamond is now on, and the Y axis is set to be displayed horizontally instead of vertically. The Labels button is a state indicator showing that variable labels are set to be displayed.
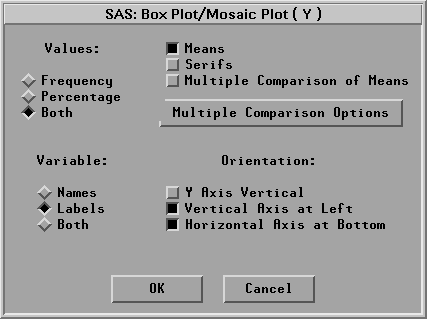
Figure 29.7: Box Plot Output Dialog
| Click OK in both the output dialog and the variables dialog |
This displays the new box plot in Figure 29.8. Note that the box plot is displayed horizontally with a mean diamond. The upper whisker is now only the same length as the box, showing more points as individual outliers. Also, the RBI axis shows the variable label instead of the variable name.
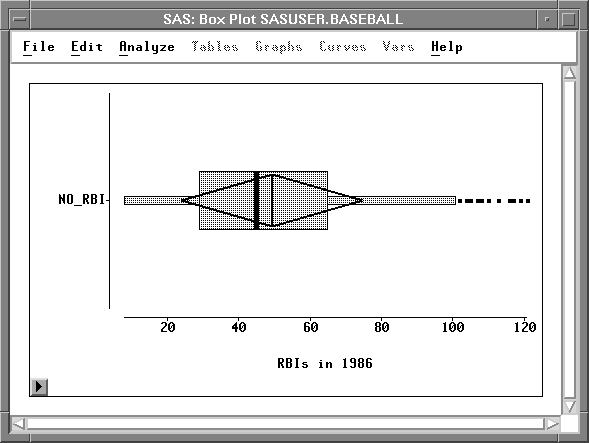
Figure 29.8: Modified Box Plot
Copyright © 2007 by SAS Institute Inc., Cary, NC, USA. All rights reserved.