| Box Plots and Mosaic Plots |
Multiple Comparison Options
Box plots enable you to examine means in different groups. Statistical questions you might have about the group means include
- Which underlying group means are likely to be different?
- Which group means are better than the mean of a standard group?
- Which group means are statistically indistinguishable from the best?
From the Multiple Comparison Options dialog, you can select a multiple comparison of means test and a confidence level for the test. Multiple comparison tests enable you to infer differences between means and also to construct simultaneous confidence intervals for these differences.
All of the tests implemented in SAS/INSIGHT software are constructed assuming that the displayed variables are independent and normally distributed with identical variance. For details, refer to Hsu (1996).
Each of the tests available in SAS/INSIGHT software is described below. In the descriptions that follow, k is the number of categories (that is, the number of boxes in the box plot), ni is the number of observations for the ith category, ![]() is the true mean for the ith category,
is the true mean for the ith category, ![]() is the sample mean for the ith category,
is the sample mean for the ith category, ![]() is the total degrees of freedom, and
is the total degrees of freedom, and ![]() is the root mean square error, also known as the pooled standard deviation. Each test creates a table showing
is the root mean square error, also known as the pooled standard deviation. Each test creates a table showing ![]() confidence intervals for the difference
confidence intervals for the difference ![]() ,
, ![]() , i = 1 ... k.
, i = 1 ... k.
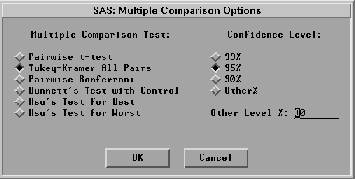
Figure 33.8: Multiple Comparison Options
The Pairwise t-test is not a true simultaneous comparison test, but rather uses a pairwise t test to provide confidence intervals about the difference between two means. These intervals have a half-width equal to ![]() . Although each confidence interval was computed at the
. Although each confidence interval was computed at the ![]() level, the probability that all of your confidence intervals are correct simultaneously is less than
level, the probability that all of your confidence intervals are correct simultaneously is less than ![]() .The actual simultaneous confidence for the t-based intervals is approximately
.The actual simultaneous confidence for the t-based intervals is approximately ![]() . For example, for five groups the actual simultaneous confidence for the t-based intervals is approximately only 75%.
. For example, for five groups the actual simultaneous confidence for the t-based intervals is approximately only 75%.
The Tukey-Kramer method is a true "multiple comparison" test, appropriate when all pairwise comparisons are of interest; it is the default test used. The test is an exact ![]() -level test if the sample sizes are the same, and it is slightly conservative for unequal sample sizes. The confidence interval around the point-estimate
-level test if the sample sizes are the same, and it is slightly conservative for unequal sample sizes. The confidence interval around the point-estimate ![]() has half-width
has half-width ![]() . It is a common convention to report the quantity
. It is a common convention to report the quantity ![]() as the Tukey-Kramer quantile, rather than just q*.
as the Tukey-Kramer quantile, rather than just q*.
The Pairwise Bonferroni method is also appropriate when all pairwise comparisons are of interest. It is conservative; that is, Bonferroni tests performed at a nominal significance level of ![]() actually have a somewhat greater level of significance. The Bonferroni method uses the t distribution, like the pairwise t test, but returns smaller intervals with half-width
actually have a somewhat greater level of significance. The Bonferroni method uses the t distribution, like the pairwise t test, but returns smaller intervals with half-width ![]() .Note that the t probability (
.Note that the t probability (![]() , since this is a two-sided test) is divided by the total number of pairwise comparisons (k(k-1)/2). The Bonferroni test produces wider confidence intervals than the Tukey-Kramer test.
, since this is a two-sided test) is divided by the total number of pairwise comparisons (k(k-1)/2). The Bonferroni test produces wider confidence intervals than the Tukey-Kramer test.
Dunnett's Test with Control is a two-sided multiple comparison method used to compare a set of categories to a control group. The quantile that scales the confidence interval is usually denoted |d|. If the ith confidence interval does not include zero, you may infer that the ith group is significantly different from the control. A control group may be a placebo or null treatment, or it may be a standard treatment. While the interactive nature of SAS/INSIGHT enables you to select any category to use as the basis of comparison in Dunnett's test, you should select a category only if it truly is the control group. To select a category, click on the corresponding comparison circle.
Hsu's Test for Best can be used to screen out group means that are statistically less than the (unknown) largest true mean. It forms nonsymmetric confidence intervals around the difference between the largest sample mean and each of the others. If an interval does not properly contain zero in its interior, then you may infer that the associated group is not among the best.
Similary, Hsu's Test for Worst can be used to screen out group means that are statistically greater than the (unknown) smallest true mean. If an interval does not properly contain zero in its interior, then you may infer that the true mean of that group is not equal to the (unknown) smallest true mean.
Copyright © 2007 by SAS Institute Inc., Cary, NC, USA. All rights reserved.