XRCHART Statement: SHEWHART Procedure

Methods for Estimating the Standard Deviation
When control limits are determined from the input data, three methods (referred to as default, MVLUE, and MVGRANGE) are available
for estimating  .
.
Default Method
The default estimate for is
![\[ \hat{\sigma } = \frac{R_{1}/d_{2}(n_{1})+ \cdots + R_{N}/d_{2}(n_{N})}{N} \]](images/qcug_shewhart0063.png)
where N is the number of subgroups for which  , and
, and  is the sample range of the observations
  , . . . ,
 in the ith subgroup.
![\[ R_{i} = \max _{1 \leq j \leq n_{i}}(x_{ij}) - \min _{1 \leq j \leq n_{i}}(x_{ij}) \]](images/qcug_shewhart0068.png)
A subgroup range  is included in the calculation only if
  . The unbiasing factor
  is defined so that, if the observations are normally distributed, the expected value of is
  . Thus,
  is the unweighted average of N unbiased estimates of . This method is described in the American Society for Testing and Materials (1976).
MVLUE Method
If you specify SMETHOD=
MVLUE, a minimum variance linear unbiased estimate (MVLUE) is computed for . Refer to Burr (1969, 1976) and Nelson (1989, 1994). The MVLUE is a weighted average of N unbiased estimates of of the form  , and it is computed as
![\[ \hat{\sigma } = \frac{f_{1}R_{1}/d_{2}(n_{1})+ \cdots + f_{N}R_{N}/d_{2}(n_{N})}{f_1 + \cdots + f_ N} \]](images/qcug_shewhart0077.png)
where
![\[ f_ i = \frac{[d_2(n_ i)]^{2}}{[d_3(n_ i)]^{2}} \]](images/qcug_shewhart0078.png)
A subgroup range is included in the calculation only if , and N is the number of subgroups for which  . The unbiasing factor
  is defined so that, if the observations are normally distributed, the expected value of
  is
is  . The MVLUE assigns greater weight to estimates of from subgroups with larger sample sizes, and it is intended for situations where the subgroup sample sizes vary. If the subgroup
sample sizes are constant, the MVLUE reduces to the default estimate.
. The MVLUE assigns greater weight to estimates of from subgroups with larger sample sizes, and it is intended for situations where the subgroup sample sizes vary. If the subgroup
sample sizes are constant, the MVLUE reduces to the default estimate.
MVGRANGE Method
If you specify SMETHOD=MVGRANGE, is estimated by using a moving range of subgroup averages. This is appropriate for constructing control charts for means
when the jth measurement in the ith subgroup can be modeled as 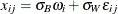 , where
  is the between-subgroup variance,
  is the within-subgroup variance, the
  are independent with zero mean and unit variance, and the are independent of the
  .
.
The estimate for is
![\[ \hat{\sigma } = \bar{R}/d_{2}(n) \]](images/qcug_shewhart0158.png)
where  is the average of the moving ranges, n is the number of consecutive subgroup averages used to compute each moving range, and the unbiasing factor
  is defined so that if the subgroup averages are normally distributed, the expected value of is
![\[ E(R_{i}) = d_{2}(n_ i)\sigma \]](images/qcug_shewhart0159.png)
This method is appropriate for constructing the three-way control chart that is advocated for this situation by Wheeler (1995). A three-way control chart is useful when sampling, or within-group variation is not the only source of variation, as discussed in Multiple Components of Variation. A three-way control chart comprises a chart of subgroup means, a moving range chart of the subgroup means, and a chart of subgroup ranges. When you specify the SMETHOD=MVGRANGE option, the XRCHART statement produces the appropriate charts of subgroup means and subgroup ranges.