NPCHART Statement: SHEWHART Procedure

Example 18.18 Applying Tests for Special Causes
Note: See np Charts-Tests for Special Causes in the SAS/QC Sample Library.
This example shows how you can apply tests for special causes to make  charts more sensitive to special causes of variation. The following statements create a SAS data set named
 Circuit3, which contains the number of failing circuits for 20 batches from the circuit manufacturing process introduced in the section
Creating np Charts from Count Data:
data Circuit3;
   input Batch Fail @@;
   datalines;
 1 12    2 21    3 16    4  9
 5  3    6  4    7  6    8  9
 9 11   10 13   11 12   12  7
13  2   14 14   15  9   16  8
17 14   18 10   19 11   20  9
;
The following statements create the chart, apply several tests to the chart, and tabulate the results:
ods graphics on;
title1'np Chart for the Number of Failing Circuits';
title2 'Tests=1 to 4';
proc shewhart data=Circuit3;
   npchart Fail*Batch / subgroupn = 500
                        tests=1 to 4
                        table
                        tabletest
                        tablelegend
                        zones
                        zonelabels
                        odstitle  = title
                        odstitle2 = title2;
run;
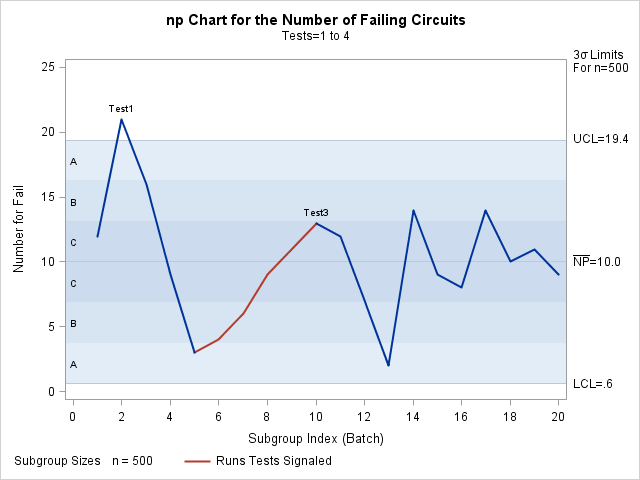
The chart is shown in Output 18.18.1, and the printed output is shown in Output 18.18.2. The TESTS= option requests Tests 1, 2, 3, and 4, which are described in Tests for Special Causes: SHEWHART Procedure. The TABLETESTS option requests a table of counts of nonconforming items and control limits, with a column indicating which subgroups tested positive for special causes. The TABLELEGEND option adds a legend describing the tests. The ZONELABELS option displays zone lines and zone labels on the chart. The zones are used to define the tests.
Output 18.18.1 and Output 18.18.2 indicate that Test 1 is positive at batch 2 and Test 3 is positive at batch 10.
Output 18.18.1: Tests for Special Causes Displayed on Chart
Output 18.18.2: Tabular Form of Chart
| np Chart for the Number of Failing Circuits |
| Tests=1 to 4 |
| np Chart Summary for Fail | |||||
|---|---|---|---|---|---|
| Batch | Subgroup Sample Size |
3 Sigma Limits with n=500 for Number | Special Tests Signaled |
||
| Lower Limit |
Subgroup Number |
Upper Limit |
|||
| 1 | 500 | 0.60851449 | 12.000000 | 19.391486 | |
| 2 | 500 | 0.60851449 | 21.000000 | 19.391486 | 1 |
| 3 | 500 | 0.60851449 | 16.000000 | 19.391486 | |
| 4 | 500 | 0.60851449 | 9.000000 | 19.391486 | |
| 5 | 500 | 0.60851449 | 3.000000 | 19.391486 | |
| 6 | 500 | 0.60851449 | 4.000000 | 19.391486 | |
| 7 | 500 | 0.60851449 | 6.000000 | 19.391486 | |
| 8 | 500 | 0.60851449 | 9.000000 | 19.391486 | |
| 9 | 500 | 0.60851449 | 11.000000 | 19.391486 | |
| 10 | 500 | 0.60851449 | 13.000000 | 19.391486 | 3 |
| 11 | 500 | 0.60851449 | 12.000000 | 19.391486 | |
| 12 | 500 | 0.60851449 | 7.000000 | 19.391486 | |
| 13 | 500 | 0.60851449 | 2.000000 | 19.391486 | |
| 14 | 500 | 0.60851449 | 14.000000 | 19.391486 | |
| 15 | 500 | 0.60851449 | 9.000000 | 19.391486 | |
| 16 | 500 | 0.60851449 | 8.000000 | 19.391486 | |
| 17 | 500 | 0.60851449 | 14.000000 | 19.391486 | |
| 18 | 500 | 0.60851449 | 10.000000 | 19.391486 | |
| 19 | 500 | 0.60851449 | 11.000000 | 19.391486 | |
| 20 | 500 | 0.60851449 | 9.000000 | 19.391486 | |