BOXCHART Statement: SHEWHART Procedure
- Overview
-
Getting Started

-
Syntax
-
Details
-
ExamplesUsing Box Charts to Compare SubgroupsCreating Various Styles of Box-and-Whisker PlotsCreating Notched Box-and-Whisker PlotsCreating Box-and-Whisker Plots with Varying WidthsCreating Box-and-Whisker Plots with Different Line Styles and ColorsComputing the Control Limits for Subgroup MaximumsConstructing Multi-Vari Charts
Example 18.5 Creating Box-and-Whisker Plots with Different Line Styles and Colors
Note: See Varying Width Box-and-Whisker Plots in the SAS/QC Sample Library.
The control limits in Output 18.4.1 apply to the subgroup means. This example illustrates how you can modify the chart to indicate whether the variability of
the process is in control. The following statements create a box chart for Delay in which a dashed outline and a light gray fill color are used for a box-and-whisker plot if the corresponding subgroup standard
deviation exceeds its  limits.
First, the SHEWHART procedure is used to create an OUTTABLE=
data set (Delaytab) that contains a variable (_EXLIMS_) that records which standard deviations exceed their limits.
proc shewhart data=Times2;
   xschart Delay * Day / nochart
                         outtable = Delaytab;
run;
Then, this information is used to set the line styles and fill colors as follows:
data Delaytab;
   length Boxcolor $ 8 ;
   set Delaytab;
   keep Day Boxcolor;
   if _exlims_ = 'UPPER' or _exlims_ = 'LOWER' then do;
      Boxcolor = 'Outside' ;
   end;
   else do;
      Boxcolor = 'Inside' ;
   end;
run;

data Times2;
   merge Times2 Delaytab;
   by Day;
run;
The following statements create the modified box chart:
ods graphics off;
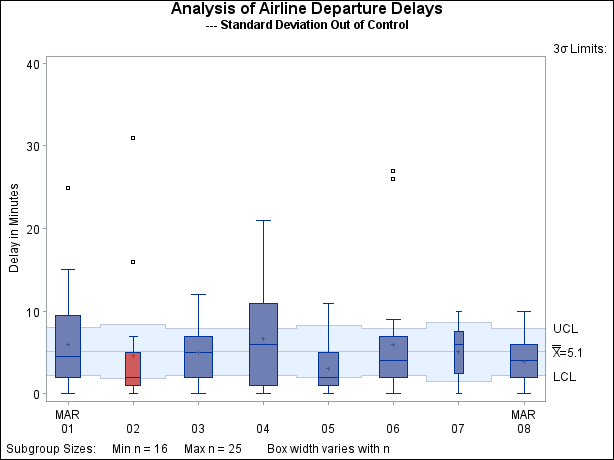
title 'Analysis of Airline Departure Delays' ;
title2 '--- Standard Deviation Out of Control';
proc shewhart data=Times2;
boxchart Delay * Day /
nohlabel
boxstyle = schematic
boxfill = ( Boxcolor )
boxwidthscale = 1
odstitle = title;
run;
The chart is shown in Output 18.5.1. The values of the variable Boxcolor specified with the BOXFILL=
option determine the fill colors. The chart indicates that the large variability for March 2 should be checked.
Output 18.5.1: Box Chart Displaying Out-of-Control Subgroup Standard Deviations