XCHART Statement: CUSUM Procedure
- Overview
-
Getting Started

-
Syntax

-
Details
 Basic Notation for Cusum ChartsFormulas for Cumulative SumsDefining the Decision Interval for a One-Sided Cusum SchemeDefining the V-Mask for a Two-Sided Cusum SchemeDesigning a Cusum SchemeCusum Charts Compared with Shewhart ChartsMethods for Estimating the Standard DeviationOutput Data SetsODS TablesODS GraphicsInput Data SetsMissing Values
 -
Examples

Reading Cusum Scheme Parameters
Note: See One-sided Cusum Chart in the SAS/QC Sample Library.
This example shows how the cusum parameters saved in the previous example can be applied to new measurements saved in a data
set named Cans2:
data Cans2;
   length pump $ 8;
   label Hour = 'Hour';
   input Hour Weight pump $ 8. ;
   datalines;
16  8.1765  Pump 3
17  8.0949  Pump 3
18  8.1393  Pump 3
19  8.1491  Pump 3
20  8.0473  Pump 1
21  8.1602  Pump 1
22  8.0633  Pump 1
23  8.0921  Pump 1
24  8.1573  Pump 1
25  8.1304  Pump 1
26  8.0979  Pump 1
27  8.2407  Pump 1
28  8.0730  Pump 1
29  8.0986  Pump 2
30  8.0785  Pump 2
31  8.2308  Pump 2
32  8.0986  Pump 2
33  8.0782  Pump 2
34  8.1435  Pump 2
35  8.0666  Pump 2
;
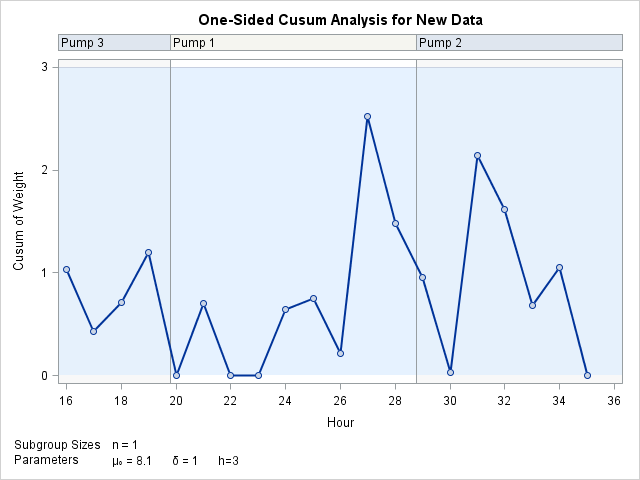
The following statements create a one-sided cusum chart for the measurements in Cans2 using the parameters in cusparm:
title "One-Sided Cusum Analysis for New Data";
proc cusum data=Cans2 limits=cusparm;
   xchart Weight*Hour( pump ) / odstitle=title markers;
   label Weight = 'Cusum of Weight';
run;
ODS Graphics remains enabled until it is disabled with the ODS GRAPHICS OFF statement, so this cusum chart is also created using ODS Graphics.
The LIMITS= option in the PROC CUSUM statement specifies the data set containing preestablished cusum parameters. The chart,
shown in Figure 6.12, indicates that the process is in control. Levels of the variable pump (referred to as a block-variable) do not enter into the analysis but are displayed in a block legend across the top of the chart. See Block Variable Legend Options
.
Figure 6.12: Cusum Chart with Decision Interval for New Data

In general, the parameters for a specified process and subgroup-variable are read from the first observation in the LIMITS= data set for which
-
the value of
_VAR_matches the process (in this case,Weight) -
the value of
_SUBGRP_matches the subgroup-variable name (in this case,Hour)
If you are maintaining more than one set of cusum parameters for a particular process, you will find it convenient to include a special identifier variable named _INDEX_ in the LIMITS= data set. This must be a character variable of length 16. Then, if you specify READINDEX=’value’ in the XCHART statement, the parameters for a specified process and subgroup-variable are read from the first observation in the LIMITS= data set for which
-
the value of
_VAR_matches process -
the value of
_SUBGRP_matches the subgroup-variable name -
the value of
_INDEX_matches value
In this example, the LIMITS= data set was created in a previous run of the CUSUM procedure. You can also create a LIMITS= data set with the DATA step. See LIMITS= Data Set for details concerning the variables that you must provide.