UCHART Statement: SHEWHART Procedure

Note: See u Chart-Applying Tests for Special Causes in the SAS/QC Sample Library.
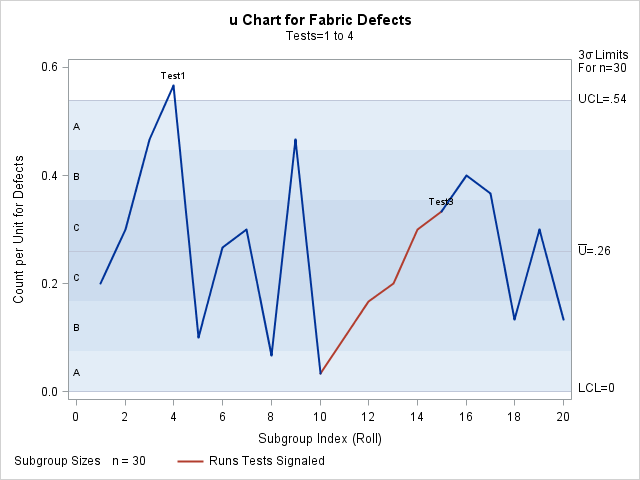
This example illustrates how you can apply tests for special causes to make u charts more sensitive to special causes of variation.
A textile company inspects rolls of fabric for defects. The rolls are one meter wide and 30 meters long. The following statements
create a SAS data set named Fabric3, which contains the number of fabric defects for 20 rolls of fabric:
data Fabric3;
   input Roll Defects @@;
   datalines;
 1   6    2   9    3  14    4  17
 5   3    6   8    7   9    8   2
 9  14   10   1   11   3   12   5
13   6   14   9   15  10   16  12
17  11   18   4   19   9   20   4
;
The following statements create a u chart and tabulate the information on the chart. The chart and tables are shown in Output 17.31.1 and Output 17.31.2.
ods graphics on;
title1 'u Chart for Fabric Defects';
title2 'Tests=1 to 4';
proc shewhart data=Fabric3;
   uchart Defects*Roll / subgroupn = 30
                         tests     = 1 to 4
                         odstitle  = title
                         odstitle2 = title2
                         tabletests
                         zonelabels;
run;
The TESTS= option requests Tests 1, 2, 3, and 4, which are described in Tests for Special Causes: SHEWHART Procedure. Only Tests 1, 2, 3, and 4 are recommended for u charts. The ZONELABELS option requests the zone lines, which are used to define the tests, and displays labels for the zones.
The TABLETESTS option requests a table of the values of ![]() and the control limits, together with a column indicating the subgroups at which the tests are positive.
and the control limits, together with a column indicating the subgroups at which the tests are positive.
Output 17.31.1 and Output 17.31.2 indicate that Test 1 is positive for Roll 4 and Test 3 is positive at Roll 15.
Output 17.31.2: Tabular Form of u Chart
| u Chart for Fabric Defects |
| Tests=1 to 4 |
| u Chart Summary for Defects | |||||
|---|---|---|---|---|---|
| Roll | Subgroup Sample Size |
3 Sigma Limits with n=30 for Count per Unit |
Special Tests Signaled |
||
| Lower Limit |
Subgroup Count per Unit |
Upper Limit |
|||
| 1 | 30.0000 | 0 | 0.20000000 | 0.53928480 | |
| 2 | 30.0000 | 0 | 0.30000000 | 0.53928480 | |
| 3 | 30.0000 | 0 | 0.46666667 | 0.53928480 | |
| 4 | 30.0000 | 0 | 0.56666667 | 0.53928480 | 1 |
| 5 | 30.0000 | 0 | 0.10000000 | 0.53928480 | |
| 6 | 30.0000 | 0 | 0.26666667 | 0.53928480 | |
| 7 | 30.0000 | 0 | 0.30000000 | 0.53928480 | |
| 8 | 30.0000 | 0 | 0.06666667 | 0.53928480 | |
| 9 | 30.0000 | 0 | 0.46666667 | 0.53928480 | |
| 10 | 30.0000 | 0 | 0.03333333 | 0.53928480 | |
| 11 | 30.0000 | 0 | 0.10000000 | 0.53928480 | |
| 12 | 30.0000 | 0 | 0.16666667 | 0.53928480 | |
| 13 | 30.0000 | 0 | 0.20000000 | 0.53928480 | |
| 14 | 30.0000 | 0 | 0.30000000 | 0.53928480 | |
| 15 | 30.0000 | 0 | 0.33333333 | 0.53928480 | 3 |
| 16 | 30.0000 | 0 | 0.40000000 | 0.53928480 | |
| 17 | 30.0000 | 0 | 0.36666667 | 0.53928480 | |
| 18 | 30.0000 | 0 | 0.13333333 | 0.53928480 | |
| 19 | 30.0000 | 0 | 0.30000000 | 0.53928480 | |
| 20 | 30.0000 | 0 | 0.13333333 | 0.53928480 | |