SCHART Statement: SHEWHART Procedure

Note: See Standard Deviation Chart (s Chart) Example in the SAS/QC Sample Library.
In the previous example, the OUTLIMITS= data set Turblim saved control limits computed from the measurements in Turbine. This example shows how these limits can be applied to new data.
The following statements create an s chart for new measurements in the data set Turbine2 (not listed here) using the control limits in Turblim:
ods graphics on;
title 'Chart for Standard Deviations of Power Output';
proc shewhart data=Turbine2 limits=Turblim;
   schart KWatts*Day / odstitle=title;
run;
The ODS GRAPHICS ON statement specified before the PROC SHEWHART statement enables ODS Graphics, so the s chart is created by using ODS Graphics instead of traditional graphics. The chart is shown in Figure 17.85.
The LIMITS= option in the PROC SHEWHART statement specifies the data set containing the control limits. By default, this information is read from the first observation in the LIMITS= data set for which
-
the value of
_VAR_matches the process nameKWatts -
the value of
_SUBGRP_matches the subgroup-variable nameDay
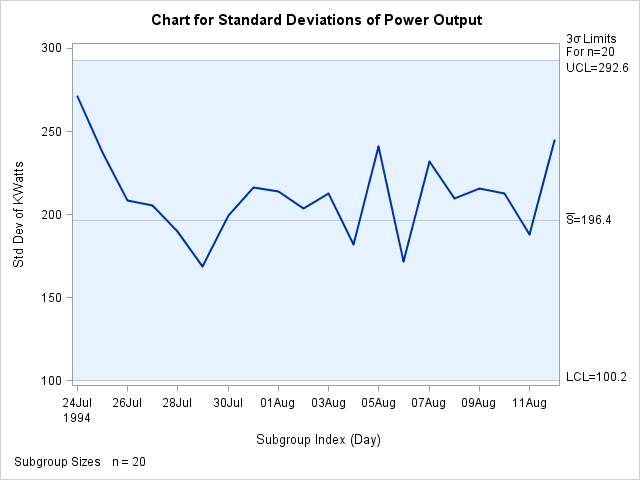
All the standard deviations lie within the control limits, indicating that the variability of the heating process is still in statistical control.
In this example, the LIMITS= data set was created in a previous run of the SHEWHART procedure. You can also create a LIMITS= data set with the DATA step. See LIMITS= Data Set for details concerning the variables that you must provide.