MCHART Statement: SHEWHART Procedure

The following data set (Wire) contains breaking strength measurements recorded in pounds per inch for 25 samples from a metal wire manufacturing process.
The subgroup sample sizes vary between 3 and 7.
data Wire;
   input Sample Size @;
   do i=1 to Size;
      input Breakstrength @@;
      output;
   end;
   drop i Size;
   label Breakstrength  ='Breaking Strength (lb/in)'
         Sample ='Sample Index';
   datalines;
 1  5 60.6 62.3 62.0 60.4 59.9
 2  5 61.9 62.1 60.6 58.9 65.3
 3  4 57.8 60.5 60.1 57.7
 4  5 56.8 62.5 60.1 62.9 58.9
 5  5 63.0 60.7 57.2 61.0 53.5
 6  7 58.7 60.1 59.7 60.1 59.1 57.3 60.9
 7  5 59.3 61.7 59.1 58.1 60.3
 8  5 61.3 58.5 57.8 61.0 58.6
 9  6 59.5 58.3 57.5 59.4 61.5 59.6
10  5 61.7 60.7 57.2 56.5 61.5
11  3 63.9 61.6 60.9
12  5 58.7 61.4 62.4 57.3 60.5
13  5 56.8 58.5 55.7 63.0 62.7
14  5 62.1 60.6 62.1 58.7 58.3
15  5 59.1 60.4 60.4 59.0 64.1
16  5 59.9 58.8 59.2 63.0 64.9
17  6 58.8 62.4 59.4 57.1 61.2 58.6
18  5 60.3 58.7 60.5 58.6 56.2
19  5 59.2 59.8 59.7 59.3 60.0
20  5 62.3 56.0 57.0 61.8 58.8
21  4 60.5 62.0 61.4 57.7
22  4 59.3 62.4 60.4 60.0
23  5 62.4 61.3 60.5 57.7 60.2
24  5 61.2 55.5 60.2 60.4 62.4
25  5 59.0 66.1 57.7 58.5 58.9
;
The following statements request a median chart, shown in Output 17.15.1, for the wire breaking strength measurements:
title 'Median Chart for Breaking Strengths';
ods graphics on;
proc shewhart data=Wire;
   mchart Breakstrength*Sample / odstitle=title;
run;
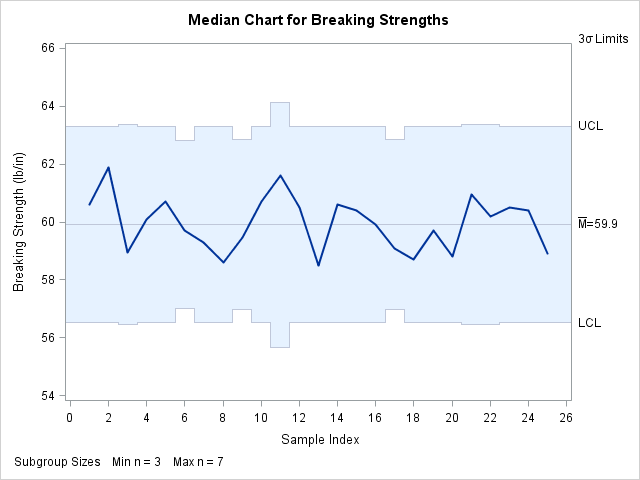
Note that the control limits vary with the subgroup sample size. The sample size legend in the lower left corner displays the minimum and maximum subgroup sample sizes.
By default, the control limits shown in Output 17.15.1 are ![]() limits estimated from the data. You can use the STDDEVIATIONS option and the SMETHOD= option in the MCHART statement to control
how the estimate of the process standard deviation
limits estimated from the data. You can use the STDDEVIATIONS option and the SMETHOD= option in the MCHART statement to control
how the estimate of the process standard deviation ![]() is calculated. The STDDEVIATIONS option specifies that the estimate of
is calculated. The STDDEVIATIONS option specifies that the estimate of ![]() is to be calculated from subgroup standard deviations rather than subgroup ranges, the default. The SMETHOD= option specifies
the method for estimating
is to be calculated from subgroup standard deviations rather than subgroup ranges, the default. The SMETHOD= option specifies
the method for estimating ![]() . You can specify the following methods:
. You can specify the following methods:
-
NOWEIGHT
-
MVLUE
-
RMSDF
The NOWEIGHT method, which is the default, requests an unweighted average of subgroup estimates, the MVLUE method requests a minimum variance linear unbiased estimate, and the RMSDF method requests a weighted root-mean-square estimate. Note that the RMSDF method is only available if, in addition, you specify the STDDEVIATIONS option. For details, see Methods for Estimating the Standard Deviation.
The following statements contain five MCHART statements, which calculate five different estimates for ![]() by specifying different combinations of options:
by specifying different combinations of options:
title 'Estimates of the Process Standard Deviation';
proc shewhart data=Wire;
   mchart Breakstrength*Sample / outlimits=Wirelim1
                         nochart outindex ='NOWEIGHT-Ranges';
   mchart Breakstrength*Sample / outlimits=Wirelim2
                         stddeviations
                         nochart outindex ='NOWEIGHT-Stds';
   mchart Breakstrength*Sample / outlimits=Wirelim3
                         smethod  =mvlue
                         nochart outindex ='MVLUE   -Ranges';
   mchart Breakstrength*Sample / outlimits=Wirelim4
                         stddeviations
                         smethod  =mvlue
                         nochart outindex ='MVLUE   -Stds';
   mchart Breakstrength*Sample / outlimits=Wirelim5
                         stddeviations
                         smethod  =rmsdf
                         nochart outindex ='RMSDF   -Stds';
run;
The OUTLIMITS= option names the data set containing the control limit information. The _STDDEV_ variable in the OUTLIMITS= data set contains the estimate of the process standard deviation. The OUTINDEX= option specifies
the value of the _INDEX_ variable in the OUTLIMITS= data set and is used in this example to identify the estimation method. The following statements
create a data set named Wlimits, which contains the five different estimates. This data set is listed in Output 17.15.2.
data Wlimits;
   set Wirelim1 Wirelim2 Wirelim3 Wirelim4 Wirelim5;
   keep _index_ _stddev_;
run;
The median chart shown in Output 17.14.1 uses the estimate listed first in Output 17.15.2 (![]() ), since the MCHART statement used to create this chart omitted the STDDEVIATIONS option and the SMETHOD= option.
), since the MCHART statement used to create this chart omitted the STDDEVIATIONS option and the SMETHOD= option.