MCHART Statement: SHEWHART Procedure

You can specify options in the MCHART statement to request one of the following values for the central line on median charts:
-
the average of the subgroup medians
-
the average of the subgroup means
-
the median of the subgroup medians
-
a standard value of the process mean
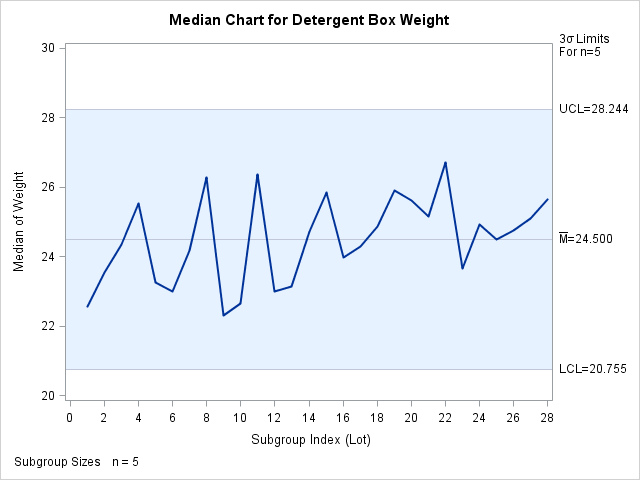
By default, the value of the central line is the average of the subgroup medians. The following statements create a median
chart for the detergent box weights stored in the data set Detergent (see Creating Charts for Medians from Raw Data) with the average of the subgroup medians as the central line. The resulting chart is shown in Output 17.14.1.
ods graphics on;
title 'Median Chart for Detergent Box Weight';
proc shewhart data=Detergent;
   mchart Weight*Lot / ndecimal = 3
                       odstitle = title;
run;
The NDECIMAL= option specifies the number of decimal digits in the default labels for the control limits and central line.
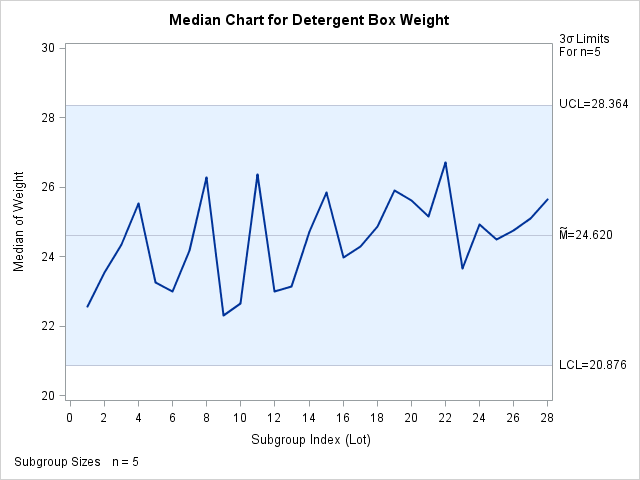
You can also request that the central line indicate the average of the subgroup means. The following statements create a median chart with this value for the central line:
title 'Median Chart for Detergent Box Weight';
proc shewhart data=Detergent;
   mchart Weight*Lot / ndecimal   = 3
                       odstitle   = title
                       medcentral = avgmean;
run;
The MEDCENTRAL= option specifies the value used for the central line. In this case, MEDCENTRAL=AVGMEAN is specified to request a central line indicating the average of the subgroup means. The resulting chart is shown in Output 17.14.2.

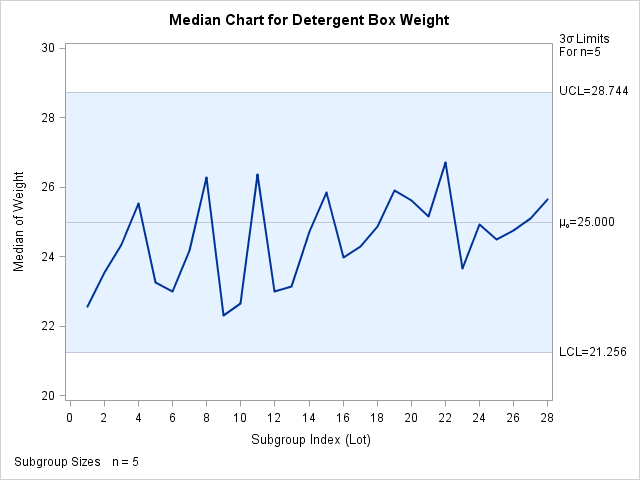
If you specify MEDCENTRAL=MEDMED, the median of the subgroup medians is used for the central line, as demonstrated by the following statements:
title 'Median Chart for Detergent Box Weight';
proc shewhart data=Detergent;
   mchart Weight*Lot / ndecimal   = 3
                       odstitle   = title
                       medcentral = medmed;
run;
The resulting chart is shown in Output 17.14.3.
In some situations a standard value for the process mean (![]() ) is available. For instance, extensive startup testing provides an estimate of the process mean. If specified, this value
is used for the central line. The following statements create a median chart for the detergent box weights with
) is available. For instance, extensive startup testing provides an estimate of the process mean. If specified, this value
is used for the central line. The following statements create a median chart for the detergent box weights with ![]() :
:
title 'Median Chart for Detergent Box Weight';
proc shewhart data=Detergent;
   mchart Weight*Lot / ndecimal = 3
                       mu0      = 25
                       odstitle = title
                       xsymbol  = mu0;
run;
The MU0= option specifies the standard value for the process mean, and the XSYMBOL= option specifies the label for the central line. In this case, XSYMBOL=MU0 is specified to indicate that the central line represents a standard value. The resulting chart is shown in Output 17.14.4.
Note that you can also provide ![]() with the
with the _MEAN_ variable in a LIMITS= data set. For example, the following DATA step creates a data set (Dlims) which contains the same standard value specified in the preceding MCHART statement:
data Dlims;
   _var_    = "Weight  ";
   _subgrp_ = "Lot     ";
   _mean_   = 25;
run;
The _VAR_ and _SUBGRP_ variables are required if this data set is to be read as a LIMITS= data set in the PROC SHEWHART statement. These values
must match the names of the process and subgroup-variable specified in the MCHART statement. The following statements specify the data set Dlims as a LIMITS= data set and create a median chart (not shown here) identical to the one in Output 17.14.4:
title 'Median Chart for Detergent Box Weight';
proc shewhart data=Detergent limits=Dlims;
   mchart Weight*Lot / xsymbol  = mu0
                       odstitle = title
                       ndecimal = 3;
run;
For more information, see Constructing Median Charts.