BOXCHART Statement: SHEWHART Procedure
- Overview
-
Getting Started

-
Syntax
-
Details
-
ExamplesUsing Box Charts to Compare SubgroupsCreating Various Styles of Box-and-Whisker PlotsCreating Notched Box-and-Whisker PlotsCreating Box-and-Whisker Plots with Varying WidthsCreating Box-and-Whisker Plots with Different Line Styles and ColorsComputing the Control Limits for Subgroup MaximumsConstructing Multi-Vari Charts
Note: See Using Box Charts to Compare Subgroups in the SAS/QC Sample Library.
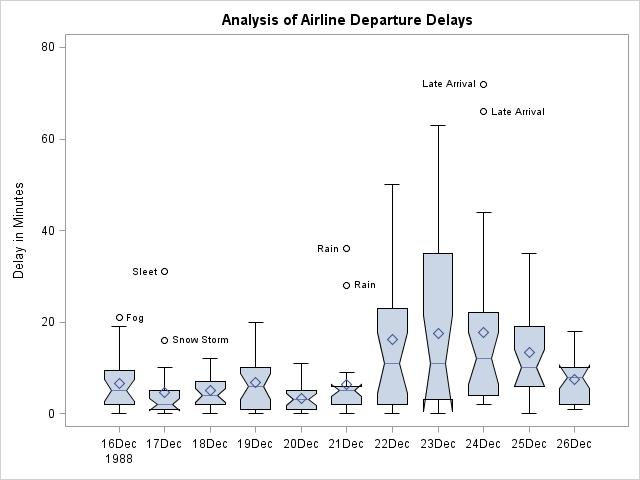
The following statements use the flight delay data of Example 17.1 to illustrate how to create side-by-side box-and-whisker plots with notches:
title 'Analysis of Airline Departure Delays';
proc shewhart data=Times limits=Timelim ;
   boxchart Delay * Day /
      odstitle = title
      boxstyle = schematicid
      nolimits
      nohlabel
      nolegend
      notches;
   id Reason;
   label Delay = 'Delay in Minutes';
run;
The control limits are suppressed with the NOLIMITS option. The notches, requested with the NOTCHES option, measure the significance of the difference between two medians. The medians are significantly different at approximately the 95% level if the notches do not overlap. For details, see the entry for NOTCHES in Dictionary of Options: SHEWHART Procedure.