BOXCHART Statement: SHEWHART Procedure
- Overview
-
Getting Started

-
Syntax
-
Details
-
ExamplesUsing Box Charts to Compare SubgroupsCreating Various Styles of Box-and-Whisker PlotsCreating Notched Box-and-Whisker PlotsCreating Box-and-Whisker Plots with Varying WidthsCreating Box-and-Whisker Plots with Different Line Styles and ColorsComputing the Control Limits for Subgroup MaximumsConstructing Multi-Vari Charts
Note: See Using Box Charts to Compare Subgroups in the SAS/QC Sample Library.
In this example, a box chart is used to compare the delay times for airline flights during the Christmas holidays with the
delay times prior to the holiday period. The following statements create a data set named Times with the delay times in minutes for 25 flights each day. When a flight is cancelled, the delay is recorded as a missing value.
data Times;
   informat Day date7. ;
   format   Day date7. ;
   input Day @ ;
   do Flight=1 to 25;
      input Delay @ ;
      output;
   end;
   datalines;
16DEC88   4  12   2   2  18   5   6  21   0   0
          0  14   3   .   2   3   5   0   6  19
          7   4   9   5  10
17DEC88   1  10   3   3   0   1   5   0   .   .
          1   5   7   1   7   2   2  16   2   1
          3   1  31   5   0
18DEC88   7   8   4   2   3   2   7   6  11   3
          2   7   0   1  10   2   3  12   8   6
          2   7   2   4   5
19DEC88  15   6   9   0  15   7   1   1   0   2
          5   6   5  14   7  20   8   1  14   3
         10   0   1  11   7
20DEC88   2   1   0   4   4   6   2   2   1   4
          1  11   .   1   0   6   5   5   4   2
          2   6   6   4   0
21DEC88   2   6   6   2   7   7   5   2   5   0
          9   2   4   2   5   1   4   7   5   6
          5   0   4  36  28
22DEC88   3   7  22   1  11  11  39  46   7  33
         19  21   1   3  43  23   9   0  17  35
         50   0   2   1   0
23DEC88   6  11   8  35  36  19  21   .   .   4
          6  63  35   3  12  34   9   0  46   0
          0  36   3   0  14
24DEC88  13   2  10   4   5  22  21  44  66  13
          8   3   4  27   2  12  17  22  19  36
          9  72   2   4   4
25DEC88   4  33  35   0  11  11  10  28  34   3
         24   6  17   0   8   5   7  19   9   7
         21  17  17   2   6
26DEC88   3   8   8   2   7   7   8   2   5   9
          2   8   2  10  16   9   5  14  15   1
         12   2   2  14  18
;
First, the MEANS procedure is used to count the number of cancelled flights for each day. This information is then added to
the data set Times.
proc means data=Times noprint;
   var Delay;
   by Day ;
   output out=Cancel nmiss=Ncancel;

data Times;
   merge Times cancel;
   by Day;
run;
The following statements create a data set named Weather that contains information about possible causes for delays. This data set is merged with the data set Times.
data Weather;
   informat Day date7. ;
   format   Day date7. ;
   length Reason $ 16 ;
   input Day Flight Reason & ;
   datalines;
16DEC88  8   Fog
17DEC88  18  Snow Storm
17DEC88  23  Sleet
21DEC88  24  Rain
21DEC88  25  Rain
22DEC88  7   Mechanical
22DEC88  15  Late Arrival
24DEC88  9   Late Arrival
24DEC88  22  Late Arrival
;

data Times;
   merge Times Weather;
   by Day Flight;
run;
Next, control limits are established using the delays prior to the holiday period.
   proc shewhart data=Times;
      where Day <= '21DEC88'D;
      boxchart Delay * Day /
         nochart
         outlimits=Timelim;
   run;
The OUTLIMITS= option names a data set (Timelim) that saves the control limits. The NOCHART option suppresses the display of the chart.
The following statements create a box chart for the complete set of data using the control limits in Timelim:
ods graphics on;
title 'Box Chart for Airline Delays';
proc shewhart data=Times limits=Timelim ;
   boxchart Delay * Day = Ncancel /
      readlimits
      nohlabel
      nolegend
      odstitle = title;
   label Delay   = 'Delay in Minutes'
         Ncancel = 'Cancellations:';
run;
The box chart is shown in Output 17.1.1. The level of the symbol-variable Ncancel determines the symbol marker for each subgroup mean, and the SYMBOLLEGEND= option controls the appearance of the legend for
the symbols. The NOHLABEL option suppresses the label for the horizontal axis, and the NOLEGEND option suppresses the default
legend for subgroup sample sizes.
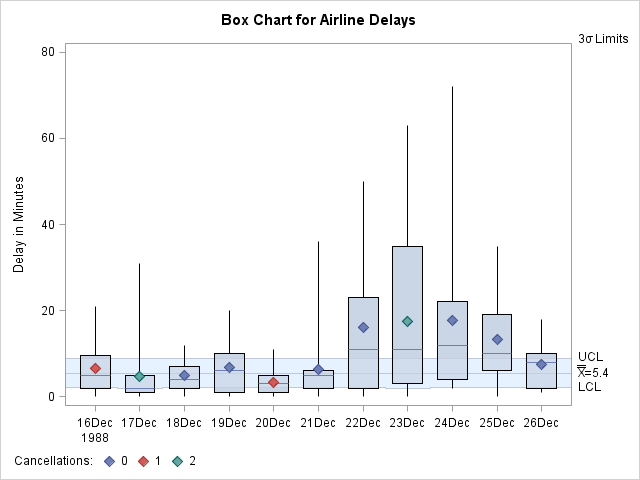
The delay distributions from December 22 through December 25 are drastically different from the delay distributions during the pre-holiday period. Both the mean delay and the variability of the delays are much greater during the holiday period.