UCHART Statement: SHEWHART Procedure

Note: See u Charts-Varying Number of Inspection Units in the SAS/QC Sample Library.
In the fabric manufacturing process described in Creating u Charts from Defect Count Data, each roll of fabric is 30 meters long, and an inspection unit is defined as one square meter. Thus, there are 30 inspection
units in each subgroup sample. Suppose now that the length of each piece of fabric varies. The following statements create
a SAS data set (Fabrics2) that contains the number of fabric defects and size (in square meters) of 25 pieces of fabric:
data Fabrics2;
   input Roll Defects Squaremeters @@;
   datalines;
 1  7 30.0   2 11 27.6   3 15 30.4   4  6 34.8   5 11 26.0
 6 15 28.6   7  5 28.0   8 10 30.2   9  8 28.2  10  3 31.4
11  3 30.3  12 14 27.8  13  3 27.0  14  9 30.0  15  7 32.1
16  6 34.8  17  7 26.5  18  5 30.0  19 14 31.3  20 13 31.6
21 11 29.4  22  6 28.6  23  6 27.5  24  9 32.6  25 11 31.7
;
A partial listing of Fabrics2 is shown in Output 17.33.1.
Output 17.33.1: The Data Set Fabrics2
| Number of Fabric Defects |
| Roll | Defects | Squaremeters |
|---|---|---|
| 1 | 7 | 30.0 |
| 2 | 11 | 27.6 |
| 3 | 15 | 30.4 |
| 4 | 6 | 34.8 |
| 5 | 11 | 26.0 |
The variable Roll contains the roll number, the variable Defects contains the number of defects in each piece of fabric, and the variable Squaremeters contains the size of each piece.
The following statements request a u chart for the number of defects per square meter:
ods graphics off;
symbol h=1;
title 'u Chart for Fabric Defects per Square Meter';
proc shewhart data=Fabrics2;
   uchart Defects*Roll / subgroupn = Squaremeters
                         outlimits = Fablimits;
run;
The u chart is shown in Output 17.33.2, and the data set Fablimits is listed in Output 17.33.3.
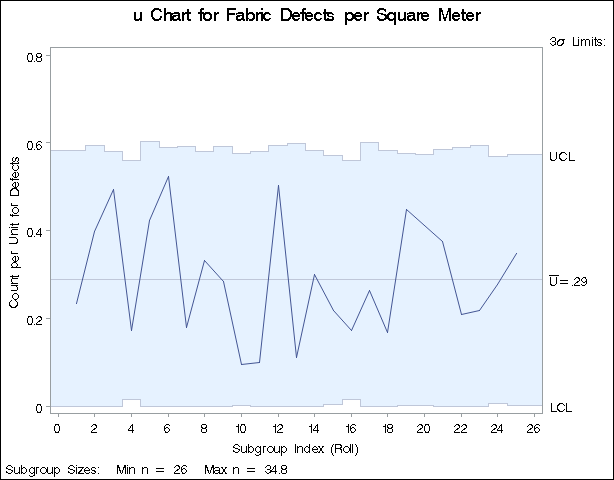
Note that the control limits vary with the number of units per subgroup (subgroup sample size). The legend in the lower left corner indicates the minimum and maximum subgroup sample sizes.
Output 17.33.3: The Control Limits Data Set Fablimits
| Control Limits for Fabric Defects |
| _VAR_ | _SUBGRP_ | _TYPE_ | _LIMITN_ | _ALPHA_ | _SIGMAS_ | _LCLU_ | _U_ | _UCLU_ |
|---|---|---|---|---|---|---|---|---|
| Defects | Roll | ESTIMATE | V | V | 3 | V | 0.28805 | V |
Output 17.33.3 shows that the variables _LIMITN_, _ALPHA_, _LCLU_, and _UCLU_ have the special missing value V, indicating that these variables vary with the sample size.
The following statements request a u chart with a fixed sample size of 30.0 for the control limits. In other words, the control limits are computed as if each piece of fabric were 30 meters long.
symbol1 c=blue v=circle;
symbol2 c=vig;
symbol3 c=salmon;
title 'u Chart for Fabric Defects per Square Meter';
proc shewhart data=Fabrics2;
   uchart Defects*Roll / subgroupn = Squaremeters
                         outlimits = Fablimits2
                         limitn    = 30
                         alln
                         nmarkers;
run;
The ALLN option specifies that points are to be displayed for all subgroups, regardless of their sample size. By default, when you specify the LIMITN= option, only points for subgroups whose sample size matches the LIMITN= value are displayed. The NMARKERS option requests special symbols that identify points for which the subgroup sample size differs from the nominal sample size of 30. The chart is shown in Output 17.33.4.
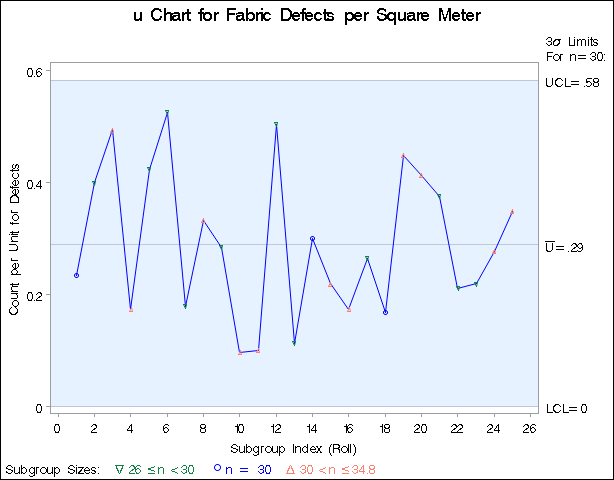
In Output 17.33.4, no points lie outside the control limits, indicating that the process is in control. However, you should be careful when
interpreting charts that use a nominal sample size, since the fixed control limits based on this value are only an approximation.
Output 17.33.5 lists the data set Fablimits2, which contains the fixed control limits displayed in Output 17.33.4.
Output 17.33.5: The Fixed Control Limits Data Set Fablimits2
| Fixed Control Limits for Fabric Defects |
| _VAR_ | _SUBGRP_ | _TYPE_ | _LIMITN_ | _ALPHA_ | _SIGMAS_ | _LCLU_ | _U_ | _UCLU_ |
|---|---|---|---|---|---|---|---|---|
| Defects | Roll | ESTIMATE | 30 | .002621618 | 3 | 0 | 0.28805 | 0.58201 |