UCHART Statement: SHEWHART Procedure

Note: See u Chart-Known Expected Number of Nonconformities in the SAS/QC Sample Library.
This example illustrates how you can create a u chart based on a known (standard) value ![]() for the expected number of nonconformities per unit.
for the expected number of nonconformities per unit.
A u chart is used to monitor the number of defects per square meter of fabric. The defect counts are provided as values of the
variable Defects in the data set Fabric (see Creating u Charts from Defect Count Data). Based on previous testing, it is known that ![]() . The following statements create a u chart with control limits derived from this value:
. The following statements create a u chart with control limits derived from this value:
ods graphics off;
title  'u Chart for Fabric Defects per Square Meter';
title2 'Using Data in FABRIC and Standard Value U0=.325';
proc shewhart data=Fabric;
   uchart Defects*Roll / subgroupn = 30
                         u0        = 0.325
                         usymbol   = u0;
run;
The chart is shown in Output 17.32.1. The U0= option specifies ![]() , and the USYMBOL= option requests a label for the central line indicating that the line represents a standard value.
, and the USYMBOL= option requests a label for the central line indicating that the line represents a standard value.
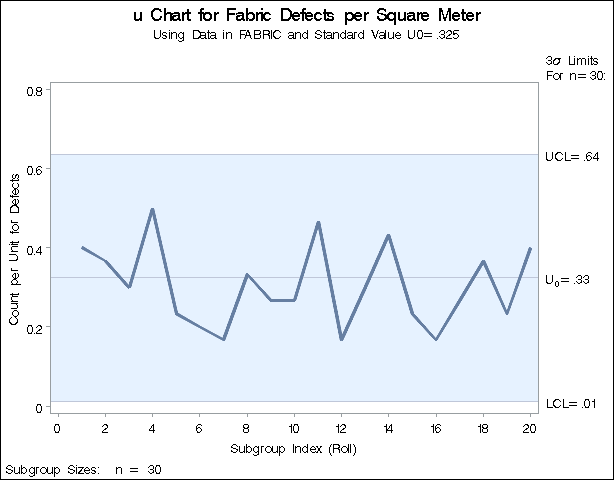
Since all the points lie within the control limits, the process is in statistical control.
Alternatively, you can specify ![]() as the value of the variable
as the value of the variable _U_ in a LIMITS= data set, as follows:
data Tlimits;
   length _subgrp_ _var_ _type_ $8;
   _u_      = .325;
   _limitn_ = 30;
   _type_   = 'STANDARD';
   _subgrp_ = 'Roll';
   _var_    = 'Defects';

proc shewhart data=Fabric limits=Tlimits;
   uchart Defects*Roll / subgroupn=30
                         usymbol  =u0;
run;
The chart produced by these statements is identical to the one in Output 17.32.1. For further details, see LIMITS= Data Set.