IRCHART Statement: SHEWHART Procedure
Note: See IRCHARTS with Margin Plots in the SAS/QC Sample Library.
You can augment a chart for individual measurements with one of several graphical displays, such as a histogram or a box-and-whisker plot. These displays summarize the measurements plotted on the chart, and, if the process is in statistical control, they provide a view of the process distribution.
For example, the following statements create an individual measurements chart for the engine weight measurements in the data
set Engines (see Example 17.11) augmented with a histogram of the weights:
ods graphics off;
title 'Individual Measurements Chart and Histogram';
proc shewhart data=Engines;
   irchart Weight*ID /
       rtmplot  = histogram
       nochart2;
run;
The chart is shown in Output 17.13.1. The RTMPLOT= option requests a histogram in the right margin. The NOCHART2 option suppresses the display of the moving range chart.
The following keywords, requesting different types of plots, are available with the RTMPLOT= option:
|
Keyword |
Marginal Plot |
|---|---|
|
HISTOGRAM |
histogram |
|
DIGIDOT |
digidot plot |
|
SKELETAL |
skeletal box-and-whisker plot |
|
SCHEMATIC |
schematic box-and-whisker plot |
|
SCHEMATICID |
schematic box-and-whisker plot with outliers labeled |
|
SCHEMATICIDFAR |
schematic box-and-whisker plot with far outliers labeled |
See the entry for the BOXSTYLE= option in Dictionary of Options: SHEWHART Procedure for a description of the various box-and-whisker plots.
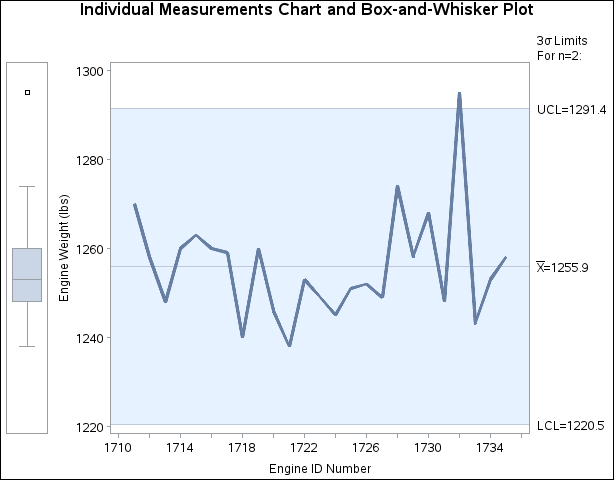
You can also use the LTMPLOT= option to request univariate plots in the left margin. The following statements request an individual measurements chart with a box-and-whisker plot in the left margin:
title 'Individual Measurements Chart and Box-and-Whisker Plot';
proc shewhart data=Engines;
   irchart Weight*ID /
       ltmplot  = schematic
       ltmargin = 8
       nochart2;
run;
The chart is shown in Output 17.13.2. The same keywords that are available with the RTMPLOT= option can be specified with the LTMPLOT= option. The LTMARGIN= option specifies the width (in horizontal percent screen units) of the left margin.


