IRCHART Statement: SHEWHART Procedure

Note: See Individual Measurement and Moving Range Charts in the SAS/QC Sample Library.
In the previous example, the OUTLIMITS= data set Jetlim saved control limits computed from the measurements in Jets. This example shows how these limits can be applied to data for an additional 20 jet engines provided in the following data
set:
data Jets2;
   input Engine Diam @@;
   label Diam   = "Inner Diameter (cm)"
         Engine = "Engine Number";
   datalines;
21 81.8  22 87.5  23 80.0  24 89.3  25 83.9
26 76.3  27 75.8  28 82.4  29 82.6  30 77.7
31 79.3  32 81.4  33 76.8  34 75.9  35 86.3
36 77.4  37 80.9  38 87.1  39 85.7  40 73.3
;
The following statements create individual measurements and moving range charts for the data in Jets2 using the control limits in Jetlim:
options nogstyle;
goptions ftext=swiss;
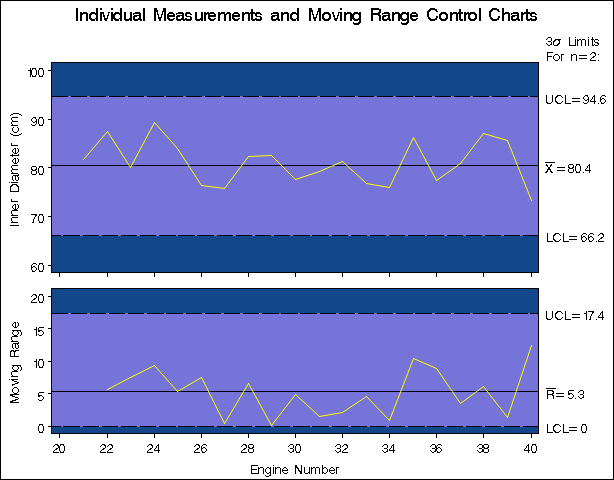
title 'Individual Measurements and Moving Range Control Charts';
proc shewhart data=Jets2 limits=Jetlim;
irchart Diam*Engine / cframe = vigb
cconnect = yellow
coutfill = red
cinfill = vlib;
run;
options gstyle;
The charts are shown in Figure 17.31. The NOGSTYLE system option causes ODS styles not to affect traditional graphics. Instead, the IRCHART statement options control the appearance of the graph. The GSTYLE system option restores the use of ODS styles for traditional graphics produced subsequently.
The LIMITS= option in the PROC SHEWHART statement specifies the data set containing the control limits. By default, this information is read from the first observation in the LIMITS= data set for which
-
the value of
_VAR_matches the process nameDiam -
the value of
_SUBGRP_matches the subgroup-variable nameEngine
The charts indicate that the process is in control, since all the individual measurements and moving ranges lie within their respective control limits.
In this example, the LIMITS= data set was created in a previous run of the SHEWHART procedure. You can also create a LIMITS= data set with the DATA step. See LIMITS= Data Set for details concerning the variables that you must provide.