Measurement Systems Analysis

The purpose of a Short EMP Study is to determine the suitability of a measurement system for measuring a particular product.
The study is designed to eliminate sources of measurement variation other than pure test-retest variation (for example, operator
effects). In this example from Wheeler (2006), ten samples of Product 833 were selected for measurement. All ten samples was measured in each of three trials. The same
operator used the same measurement instrument (Gauge 702) to perform each measurement. The following statements create a SAS
data set named Gauge702Product833, which contains the measurements:
data Gauge702Product833;
   input Trial Sample Value;
   datalines;
1  1  3.66
1  2  4.50
1  3  3.63
1  4  4.28
1  5  5.66
1  6  3.36
1  7  4.20
1  8  6.95
1  9  3.41
1 10  2.43
2  1  4.26
2  2  3.85
2  3  3.03
2  4  5.08
2  5  4.81
2  6  3.91
2  7  4.35
2  8  5.60
2  9  2.81
2 10  2.98
3  1  5.41
3  2  3.35
3  3  3.53
3  4  4.63
3  5  5.31
3  6  4.06
3  7  5.05
3  8  5.70
3  9  3.21
3 10  2.68
;
You can use the %shortemp macro to perform the study:
%shortemp(Gauge702Product833);
The default values for all the macro parameters are appropriate in this case, so you only need to specify the data set that contains the measurements.
Output A.1.1 shows the average and range (![]() and R) chart that is produced by the macro.
and R) chart that is produced by the macro.
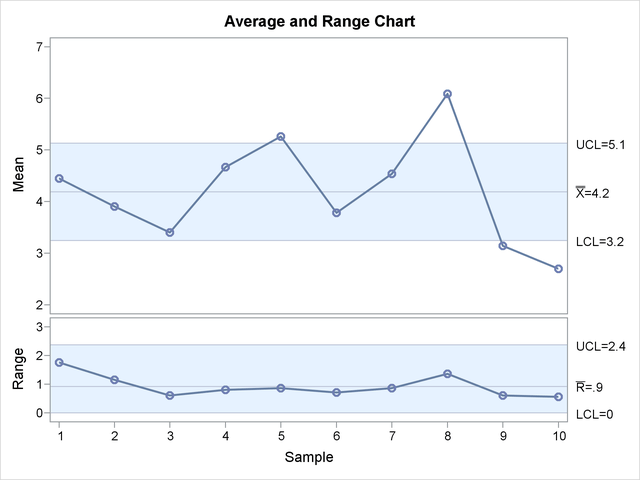
Each subgroup in the average and range charts consists of the three measurements for a particular sample. Because the same part is measured three times, the subgroup ranges indicate the test-retest variation. With no ranges outside the control limits, there is no evidence of inconsistency in the measurements.
The ranges are also used to construct the limits on the average chart. Therefore the limits characterize measurement errors. Subgroup means outside or near the control limits indicate that the measurement error is not large enough to mask the process error. This measurement system should be adequate to monitor unusual variation in the process.
Output A.1.2 shows the summary table produced by the macro.
Output A.1.2: Short EMP Study Results
| Short EMP Study for Gauge702Product833 |
| Short EMP Analysis | |
|---|---|
| Upper-Range Limit Check | Not Exceeded |
| Number of Samples | 10 |
| Number of Replications | 3 |
| Probable Error for Single Determination | 0.36690 |
| Measurement Increment | 0.01 |
| Measurement Increment Action | Might Drop a Digit |
| Test-Retest Error for Reported Value | 0.29545 |
| Estimated Variance of Product | 0.93992 |
| Intraclass Correlation | 0.7608 |
| System Classification | Second Class |
Note the probable error and measurement increment values. According to Wheeler (2006), the smallest effective measurement increment is 0.2 times the probable error, and the largest effective measurement increment
is 2 times the probable error. In this case the measurement increment is only about ![]() of the probable error. The second decimal place in the measurements is suspect, and the report recommends that the last digit
could be dropped.
of the probable error. The second decimal place in the measurements is suspect, and the report recommends that the last digit
could be dropped.