XCHART Statement: ANOM Procedure

Note: See ANOM for a Two-Way Classification in the SAS/QC Sample Library.
A chemical engineer is interested in the effects of two factors, position and depth, on the concentration of a cleaning solution; refer to Ramig (1983) for details concerning the use of ANOM in a two-way classification such as this. The engineer is interested in the following questions:
-
Are there significant group or interaction effects due to position or depth?
-
Assuming a main effect is significant, which levels are significantly different from the overall mean and in which direction?
There are five positions and three depths. The engineer runs a two-way factorial experiment with two replications per cell.
The following statements create a data set named Cleaning, which provides the concentration measurements for the ![]() observations.
observations.
data Cleaning;
   do position = 1 to 5;
      do depth = 1 to 3;
         do rep = 1 to 2;
            input concentration @@;
            output;
         end;
      end;
   end;
datalines;
15 16 15 14 19 5
15 16 14 14 0  8
19 15 16 16 11 8
18 16 19 15 8  14
15 12 19 15 8  11
;
In order to test for main effects and an interaction effect, the following statements use the GLM procedure:
ods graphics off;
proc glm data=Cleaning;
   class position depth;
   model concentration = position depth position*depth;
run;
The results are shown in Output 4.5.1:
Output 4.5.1: GLM Results
| Analysis of Label Deviations |
| Source | DF | Sum of Squares | Mean Square | F Value | Pr > F |
|---|---|---|---|---|---|
| Model | 14 | 390.4666667 | 27.8904762 | 2.21 | 0.0694 |
| Error | 15 | 189.0000000 | 12.6000000 | ||
| Corrected Total | 29 | 579.4666667 |
| R-Square | Coeff Var | Root MSE | concentration Mean |
|---|---|---|---|
| 0.673838 | 26.22893 | 3.549648 | 13.53333 |
| Source | DF | Type I SS | Mean Square | F Value | Pr > F |
|---|---|---|---|---|---|
| position | 4 | 50.4666667 | 12.6166667 | 1.00 | 0.4374 |
| depth | 2 | 281.6666667 | 140.8333333 | 11.18 | 0.0011 |
| position*depth | 8 | 58.3333333 | 7.2916667 | 0.58 | 0.7802 |
The results in Output 4.5.1 show no significant interaction effect[4] and a significant main effect due to depth. Since no interaction effect is present, you can use analysis of means to evaluate
the effect of each factor as if two separate experiments had been run to determine the effect of each factor. In other words,
the analysis of means is done twice, once for each factor. However, each analysis must be based on the mean square error (![]() ) and the degrees of freedom for error (
) and the degrees of freedom for error (![]() ) from the two-way analysis of variance. These values must be specified since the ANOM procedure assumes a one-way layout
by default for computing the decision limits.
) from the two-way analysis of variance. These values must be specified since the ANOM procedure assumes a one-way layout
by default for computing the decision limits.
The following statements create the ANOM chart for the effect of position shown in Output 4.5.2:
title "ANOM for Effect of Position";
proc anom data=Cleaning;
   xchart concentration * position /
      mse      = 12.6
      dfe      = 15
      outtable = posmain
      odstitle = title;
   label position      = 'Position'
         concentration = 'Mean of Concentration';
run;
The MSE= and DFE= options are used to specify ![]() and
and ![]() respectively. See the section Constructing ANOM Charts for Two-Way Layouts for how the specified values are used to compute the decision limits. The OUTTABLE= option stores the output data set
respectively. See the section Constructing ANOM Charts for Two-Way Layouts for how the specified values are used to compute the decision limits. The OUTTABLE= option stores the output data set PosMain, which can be used to create a combined chart for the two factors.
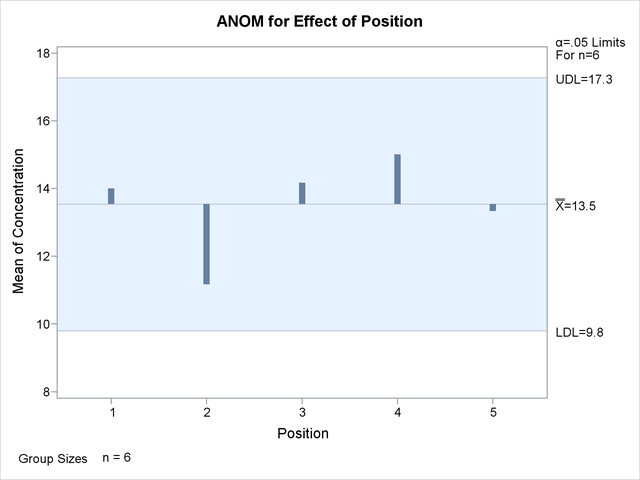
Each point on the ANOM chart represents the average response for a particular level of position. In this case, all of the
points are between the upper decision limit (UDL) and the lower decision limit (LDL). This is not surprising considering the
fact that the main effect of Position was not significant in the ANOVA.
In order to create the ANOM chart for the effect of depth, the response must be sorted by depth.
proc sort data=Cleaning out=Cleaning2;
   by depth;
run;
Note that for the previous chart, the measurements were sorted by Position in the original data set.
The following statements create the chart for depth:
title "ANOM for Effect of Depth";
proc anom data=Cleaning2;
   xchart concentration * depth /
      mse      = 12.6
      dfe      = 15
      outtable = depmain
      odstitle = title;
   label depth           = 'Depth'
         concentration   = 'Mean of Concentration';
run;
This produces the chart shown in Output 4.5.3: The OUTTABLE= option stores the output data set depmain, which can be used to create a combined chart for the two factors.
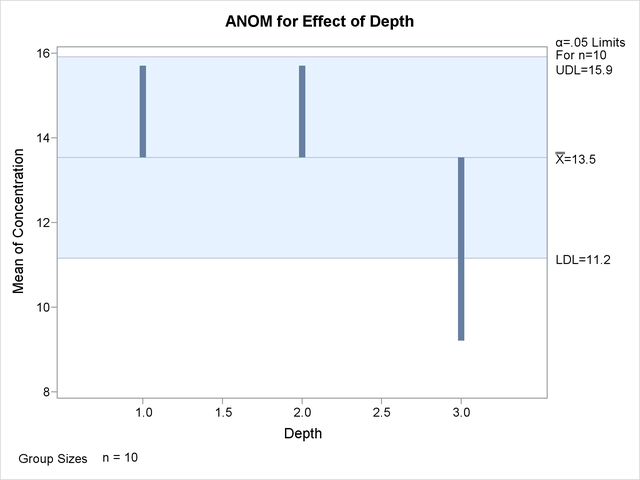
Since the average concentration for Depth 3 is less than the lower decision limit, you can conclude that the average response for Depth 3 is significantly less than the overall mean.
[4] See Example 4.7 for an example that discusses the use of ANOM for the cell means when an interaction effect is present.