XCHART Statement: ANOM Procedure

The following notation is used in this section:
|
|
jth response in the ith group |
|
k |
number of groups |
|
|
sample size of ith group |
|
N |
total sample size |
|
|
expected value of a response in the ith group |
|
|
standard deviation of a response |
|
|
average response in the ith group |
|
|
weighted average of k group means |
|
|
sample variance of the responses in the ith group |
|
|
mean square error (MSE) |
|
|
degrees of freedom associated with the mean square error |
|
|
significance level |
|
|
critical value for analysis of means when the sample sizes |
|
|
critical value for analysis of means when the sample sizes |
By default, the central line on an ANOM chart for means represents the weighted average of the group means, which is computed as
You can specify a value for ![]() with the MEAN= option in the XCHART statement or with the variable
with the MEAN= option in the XCHART statement or with the variable _MEAN_ in a LIMITS= data set.
In the analysis of means for continuous data, it is assumed that the responses in the ith group are at least approximately normally distributed with a constant variance:
When the group sizes are constant (![]() ), then
), then ![]() and the decision limits are computed as follows:
and the decision limits are computed as follows:
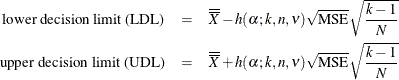
Here the mean square error (MSE) is computed as follows:
For details concerning the function ![]() , see Nelson (1982a, 1993).
, see Nelson (1982a, 1993).
When the group sizes are not constant (the unbalanced case), ![]() and the decision limits for the ith group are computed as follows:
and the decision limits for the ith group are computed as follows:
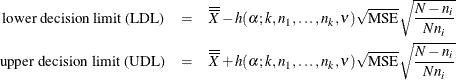
Here the mean square error (MSE) is computed as follows:
This requires that ![]() be positive. A chart is not produced if
be positive. A chart is not produced if ![]() but MSE is equal to zero (unless you specify the ZEROSTD option). For details concerning the function
but MSE is equal to zero (unless you specify the ZEROSTD option). For details concerning the function ![]() , see Nelson (1991).
, see Nelson (1991).
You can specify parameters for the limits as follows:
-
Specify
 with the ALPHA= option or with the variable
 _ALPHA_in a LIMITS= data set. By default, = 0.05.
-
Specify a constant nominal sample size
 for the decision limits in the balanced case with the LIMITN= option or with the variable
 _LIMITN_in a LIMITS= data set. By default, n is the observed sample size in the balanced case. -
Specify k with the LIMITK= option or with the variable
_LIMITK_in a LIMITS= data set. By default, k is the number of groups. -
Specify
 with the MEAN= option or with the variable
 _MEAN_in a LIMITS= data set. By default, is the weighted average of the responses.
-
Specify
 with the MSE= option or with the variable
 _MSE_in a LIMITS= data set. By default, is computed as indicated above.
-
Specify
 with the DFE= option or with the variable
 _DFE_in a LIMITS= data set. By default, is determined as indicated above.