PCHART Statement: SHEWHART Procedure

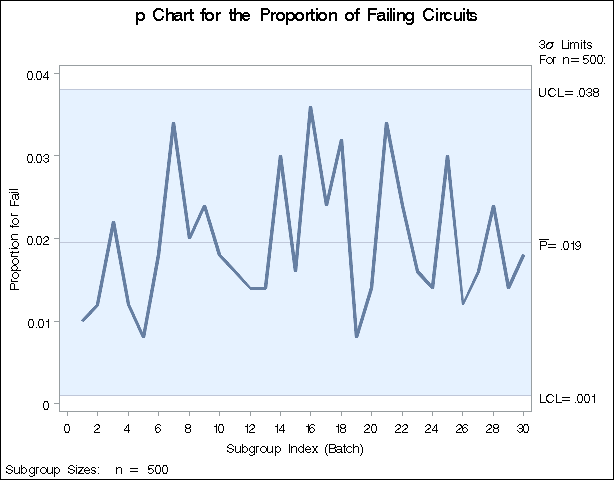
See SHWPCHR in the SAS/QC Sample LibraryAn electronics company manufactures circuits in batches of 500 and uses a p chart to monitor the proportion of failing circuits. Thirty batches are examined, and the failures in each batch are counted.
The following statements create a SAS data set named Circuits,[67] which contains the failure counts:
data Circuits;
   input Batch Fail @@;
   datalines;
1    5   2   6   3  11   4   6    5   4
6    9   7  17   8  10   9  12   10   9
11   8  12   7  13   7  14  15   15   8
16  18  17  12  18  16  19   4   20   7
21  17  22  12  23   8  24   7   25  15
26   6  27   8  28  12  29   7   30   9
;
A partial listing of Circuits is shown in Figure 17.59.
There is a single observation for each batch. The variable Batch identifies the subgroup sample and is referred to as the subgroup-variable. The variable Fail contains the number of nonconforming items in each subgroup sample and is referred to as the process variable (or process for short).
The following statements create the p chart shown in Figure 17.60:
ods graphics off;
title 'p Chart for the Proportion of Failing Circuits';
proc shewhart data=Circuits;
   pchart Fail*Batch / subgroupn = 500;
run;
This example illustrates the basic form of the PCHART statement. After the keyword PCHART, you specify the process to analyze (in this case, Fail), followed by an asterisk and the subgroup-variable (Batch).
The input data set is specified with the DATA= option in the PROC SHEWHART statement. The SUBGROUPN= option specifies the number of items in each subgroup sample and is required with a DATA= input data set. The SUBGROUPN= option specifies one of the following:
-
a constant subgroup sample size (as in this case)
-
a variable in the input data set whose values provide the subgroup sample sizes (see the next example)
Options such as SUBGROUPN= are specified after the slash (/) in the PCHART statement. A complete list of options is presented in the section Syntax: PCHART Statement.
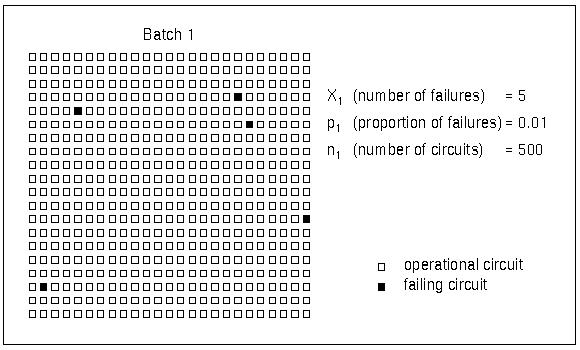
Each point on the p chart represents the proportion of nonconforming items for a particular subgroup. For instance, the value plotted for the
first batch is ![]() , as illustrated in Figure 17.61.
, as illustrated in Figure 17.61.
Since all the points fall within the control limits, it can be concluded that the process is in statistical control.
By default, the control limits shown are 3![]() limits estimated from the data; the formulas for the limits are given in Control Limits. You can also read control limits from an input data set; see Reading Preestablished Control Limits. For computational details, see Constructing Charts for Proportion Nonconforming (p Charts). For more details on reading counts of nonconforming items, see DATA= Data Set.
limits estimated from the data; the formulas for the limits are given in Control Limits. You can also read control limits from an input data set; see Reading Preestablished Control Limits. For computational details, see Constructing Charts for Proportion Nonconforming (p Charts). For more details on reading counts of nonconforming items, see DATA= Data Set.
[67] This data set is also used in the “Getting Started” section of NPCHART Statement: SHEWHART Procedure.