BOXCHART Statement: SHEWHART Procedure
- Overview
-
Getting Started

-
Syntax
-
Details
-
ExamplesUsing Box Charts to Compare SubgroupsCreating Various Styles of Box-and-Whisker PlotsCreating Notched Box-and-Whisker PlotsCreating Box-and-Whisker Plots with Varying WidthsCreating Box-and-Whisker Plots with Different Line Styles and ColorsComputing the Control Limits for Subgroup MaximumsConstructing Multi-Vari Charts
See SHWBOXA in the SAS/QC Sample LibraryThe previous example illustrates how you can create box charts using raw data (process measurements). However, in many applications the data are provided as subgroup summary statistics. This example illustrates how you can use the BOXCHART statement with data of this type.
The following data set (Oilsum) provides the data from the preceding example in summarized form. There is exactly one observation for each subgroup (note
that the subgroups are still indexed by Day).
data oilsum;
   input Day KWattsL KWatts1 KWattsX KWattsM
             KWatts3 KWattsH KWattsR KWattsN;
   informat Day date7. ;
   format Day date5. ;
   label Day    ='Date of Measurement'
         KWattsL='Minimum Power Output'
         KWatts1='25th Percentile'
         KWattsX='Average Power Output'
         KWattsM='Median Power Output'
         KWatts3='75th Percentile'
         KWattsH='Maximum Power Output'
         KWattsR='Range of Power Output'
         KWattsN='Subgroup Sample Size';
   datalines;
04JUL94 3180 3340.0 3487.40 3490.0 3610.0 4050 870 20
05JUL94 3179 3333.5 3471.65 3419.5 3605.0 3849 670 20
06JUL94 3304 3376.0 3488.30 3456.5 3604.5 3781 477 20
07JUL94 3045 3390.5 3434.20 3447.0 3550.0 3629 584 20
08JUL94 2968 3321.0 3475.80 3487.0 3611.5 3916 948 20
09JUL94 3047 3425.5 3518.10 3576.0 3615.0 3881 834 20
10JUL94 3002 3368.5 3492.65 3495.5 3621.5 3787 785 20
11JUL94 3196 3346.0 3496.40 3473.5 3592.5 3994 798 20
12JUL94 3115 3188.5 3398.50 3426.0 3568.5 3731 616 20
13JUL94 3263 3340.0 3456.05 3444.0 3505.5 4040 777 20
14JUL94 3215 3336.0 3493.60 3441.5 3616.0 3872 657 20
15JUL94 3182 3409.5 3563.30 3561.0 3719.5 3850 668 20
16JUL94 3212 3378.0 3519.05 3515.0 3682.5 3769 557 20
17JUL94 3077 3329.0 3474.20 3501.5 3599.5 3812 735 20
18JUL94 3061 3315.5 3443.60 3435.0 3614.5 3815 754 20
19JUL94 3288 3426.5 3586.35 3546.0 3762.5 3877 589 20
20JUL94 3114 3373.0 3486.45 3474.5 3635.5 3928 814 20
21JUL94 3167 3400.5 3492.90 3488.0 3582.5 3801 634 20
22JUL94 3056 3322.0 3432.80 3460.0 3561.0 3800 744 20
23JUL94 3145 3308.5 3496.90 3495.0 3652.0 3917 772 20
;
A partial listing of Oilsum is shown in Figure 17.6.
Figure 17.6: The Summary Data Set Oilsum
| Summary Data Set for Power Outputs |
| Day | KWattsL | KWatts1 | KWattsX | KWattsM | KWatts3 | KWattsH | KWattsR | KWattsN |
|---|---|---|---|---|---|---|---|---|
| 04JUL | 3180 | 3340.0 | 3487.40 | 3490.0 | 3610.0 | 4050 | 870 | 20 |
| 05JUL | 3179 | 3333.5 | 3471.65 | 3419.5 | 3605.0 | 3849 | 670 | 20 |
| 06JUL | 3304 | 3376.0 | 3488.30 | 3456.5 | 3604.5 | 3781 | 477 | 20 |
| 07JUL | 3045 | 3390.5 | 3434.20 | 3447.0 | 3550.0 | 3629 | 584 | 20 |
| 08JUL | 2968 | 3321.0 | 3475.80 | 3487.0 | 3611.5 | 3916 | 948 | 20 |
There are eight summary variables in Oilsum.
-
KWattsLcontains the subgroup minimums (low values). -
KWatts1contains the 25th percentile (first quartile) for each subgroup. -
KWattsXcontains the subgroup means. -
KWattsMcontains the subgroup medians. -
KWatts3contains the 75th percentile (third quartile) for each subgroup. -
KWattsHcontains the subgroup maximums (high values). -
KWattsRcontains the subgroup ranges. -
KWattsNcontains the subgroup sample sizes.
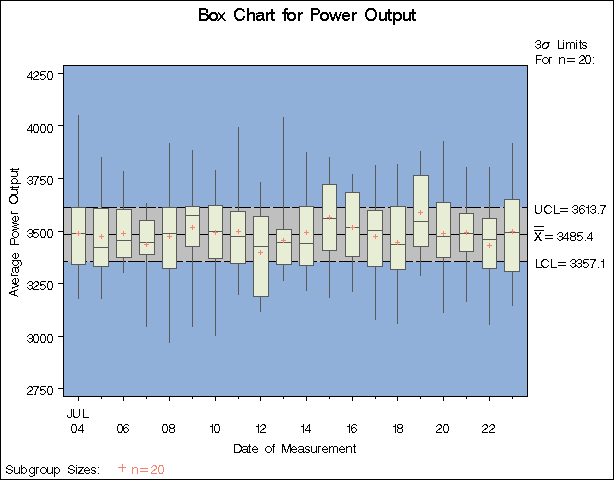
You can read this data set by specifying it as a HISTORY= data set in the PROC SHEWHART statement, as illustrated by the following statements, which create the box chart shown in Figure 17.7:
options nogstyle;
goptions ftext=swiss;
symbol color = salmon h = .8;
title 'Box Chart for Power Output';
proc shewhart history=Oilsum;
   boxchart KWatts*Day / cinfill  = ligr
                         cboxfill = ywh
                         cboxes   = dagr
                         cframe   = vligb
                         ranges;
run;
options gstyle;
The NOGSTYLE system option causes ODS styles not to affect traditional graphics. Instead, the SYMBOL statement and BOXCHART statement options control the appearance of the graph. The GSTYLE system option restores the use of ODS styles for traditional graphics produced subsequently.
Note that the process KWatts is not the name of a SAS variable in the data set but is, instead, the common prefix for the names of the eight summary variables.
The suffix characters L, 1, X, M, 3, H, R, and N indicate the contents of the variable. For example, the suffix characters 1 and 3 indicate first and third quartiles. The name Day specified after the asterisk is the name of the subgroup-variable.
In general, a HISTORY= input data set used with the BOXCHART statement must contain the following variables:
-
subgroup variable
-
subgroup minimum variable
-
subgroup first quartile variable
-
subgroup mean variable
-
subgroup median variable
-
subgroup third quartile variable
-
subgroup maximum variable
-
subgroup sample size variable
-
either a subgroup standard deviation variable or a subgroup range variable
Furthermore, the names of the summary variables must begin with the process name specified in the BOXCHART statement and end with the appropriate suffix character. If the names do not follow this convention, you can use the RENAME option in the PROC SHEWHART statement to rename the variables for the duration of the SHEWHART procedure step (see Creating Charts for Means and Ranges from Summary Data).
If you specify the RANGES option in the BOXCHART statement, the HISTORY= data set must contain a subgroup range variable;
otherwise, the HISTORY= data set must contain a subgroup standard deviation variable. The RANGES option specifies that the
estimate of the process standard deviation ![]() is to be calculated from subgroup ranges rather than subgroup standard deviations. For example, in the following statements,
the data set
is to be calculated from subgroup ranges rather than subgroup standard deviations. For example, in the following statements,
the data set Oilsum2 must contain a subgroup standard deviation variable named KWattsS, because the RANGES option not specified:
title 'Box Chart for Power Output';
proc shewhart history=Oilsum2;
   boxchart KWatts*Day;
run;
In summary, the interpretation of process depends on the input data set.
-
If raw data are read using the DATA= option (as in the previous example), process is the name of the SAS variable containing the process measurements.
-
If summary data are read using the HISTORY= option (as in this example), process is the common prefix for the names of the variables containing the summary statistics.
For more information, see HISTORY= Data Set.