Details and Examples: PARETO Procedure
-
Details

-
ExamplesCreating Before-and-After Pareto ChartsCreating Two-Way Comparative Pareto ChartsHighlighting the Vital FewHighlighting Combinations of CategoriesHighlighting Combinations of CellsOrdering Rows and Columns in a Comparative Pareto ChartMerging Columns in a Comparative Pareto ChartCreating Weighted Pareto ChartsAlternative Pareto Charts
See PARETO13 in the SAS/QC Sample LibraryThis example illustrates methods for controlling the order of rows and columns in a comparative Pareto chart.
The following statements create a data set named Failure7:
proc format;
   value procfmt   1   = 'Process A'
                   2   = 'Process B';
   value dayfmt    1   = 'Monday'
                   2   = 'Tuesday'
                   3   = 'Wednesday'
                   4   = 'Thursday'
                   5   = 'Friday';
run;

data Failure7;
   length Cause $16;
   format Process procfmt. Day dayfmt.;
   label  Cause   = 'Cause of Failure'
          Process = 'Cleaning Method'
          Day     = 'Day of Manufacture';
   input  Process Day Cause $16. Counts @@;
   datalines;
   1   1   Contamination    15   1   1   Corrosion         2
   1   1   Doping            1   1   1   Metallization     2
   1   1   Miscellaneous     3   1   1   Oxide Defect      8
   1   1   Silicon Defect    1   1   2   Contamination    16
   1   2   Corrosion         3   1   2   Doping            1
   1   2   Metallization     3   1   2   Miscellaneous     1
   1   2   Oxide Defect      9   1   2   Silicon Defect    2
   1   3   Contamination    20   1   3   Corrosion         1
   1   3   Doping            1   1   3   Metallization     0
   1   3   Miscellaneous     3   1   3   Oxide Defect      7
   1   3   Silicon Defect    2   1   4   Contamination    12
   1   4   Corrosion         1   1   4   Doping            1
   1   4   Metallization     0   1   4   Miscellaneous     0
   1   4   Oxide Defect     10   1   4   Silicon Defect    1
   1   5   Contamination    23   1   5   Corrosion         1
   1   5   Doping            1   1   5   Metallization     0
   1   5   Miscellaneous     1   1   5   Oxide Defect      8
   1   5   Silicon Defect    2   2   1   Contamination     8
   2   1   Corrosion         2   2   1   Doping            1
   2   1   Metallization     4   2   1   Miscellaneous     2
   2   1   Oxide Defect     10   2   1   Silicon Defect    3
   2   2   Contamination     9   2   2   Corrosion         0
   2   2   Doping            1   2   2   Metallization     2
   2   2   Miscellaneous     4   2   2   Oxide Defect      9
   2   2   Silicon Defect    2   2   3   Contamination     4
   2   3   Corrosion         1   2   3   Doping            1
   2   3   Metallization     0   2   3   Miscellaneous     0
   2   3   Oxide Defect     10   2   3   Silicon Defect    1
   2   4   Contamination     2   2   4   Corrosion         2
   2   4   Doping            1   2   4   Metallization     0
   2   4   Miscellaneous     3   2   4   Oxide Defect      7
   2   4   Silicon Defect    1   2   5   Contamination     1
   2   5   Corrosion         3   2   5   Doping            1
   2   5   Metallization     0   2   5   Miscellaneous     1
   2   5   Oxide Defect      8   2   5   Silicon Defect    2
;
Note that Failure7 is similar to the data set Failure4 created in Example 15.2. Here, the classification variables Process and Day are numeric formatted variables, and the formatted values of Day are 'Monday' through 'Friday'. In Example 15.2, Process and Day are character variables, and the values of Day are 'March 1' through 'March 5'.
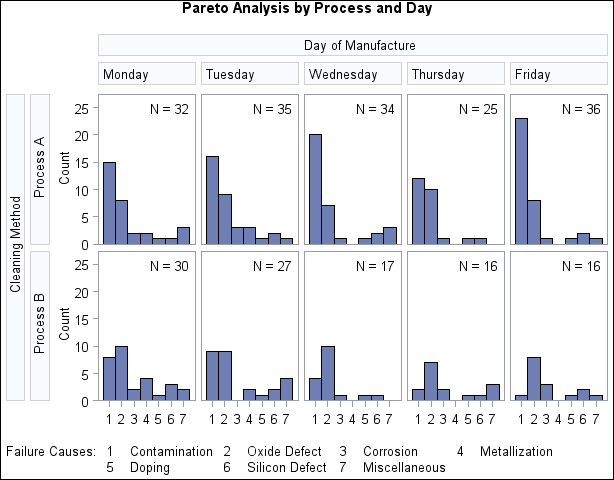
The following statements create a two-way comparative Pareto chart for Cause in which the rows represent levels of Process and the columns represent levels of Day:
ods graphics off;
title 'Pareto Analysis by Process and Day';
proc pareto data=Failure7;
   vbar Cause / class       = ( Process Day )
                freq        = Counts
                nrows       = 2
                ncols       = 5
                last        = 'Miscellaneous'
                scale       = count
                catleglabel = 'Failure Causes:'
                intertile   = 1.0
                nohlabel
                nocurve
                nlegend;
run;
The chart is shown in Output 15.6.1. The levels of the classification variables are determined by their formatted values. The default order in which the rows and columns are displayed is determined by the internal values of the classification variables, and, consequently, the columns appear in the order of the days of the week.
If Day had been defined as a character variable with values 'Monday' through 'Friday', the columns in Output 15.6.1 would have appeared in alphabetical order.
You can override the default order with the ORDER1= and ORDER2= options.